- Home
- /
- Programming
- /
- SAS Procedures
- /
- Re: Formatting 2X2 Crosstabulation
- RSS Feed
- Mark Topic as New
- Mark Topic as Read
- Float this Topic for Current User
- Bookmark
- Subscribe
- Mute
- Printer Friendly Page

- Mark as New
- Bookmark
- Subscribe
- Mute
- RSS Feed
- Permalink
- Report Inappropriate Content
Looking for a way to format the following output so that the column percents show up with zero decimal places:
proc freq data = CombineScoredTemp;
tables _node_ * Bin_SLR
/nopercent norow nofreq;
run;
Of course I could copy & paste it into Excel. Then format it. Then I would want more decimal places.
Also, is there a way to output these column percents so that a % shows up with the numbers?
Thank you very much in advance.
Accepted Solutions

- Mark as New
- Bookmark
- Subscribe
- Mute
- RSS Feed
- Permalink
- Report Inappropriate Content
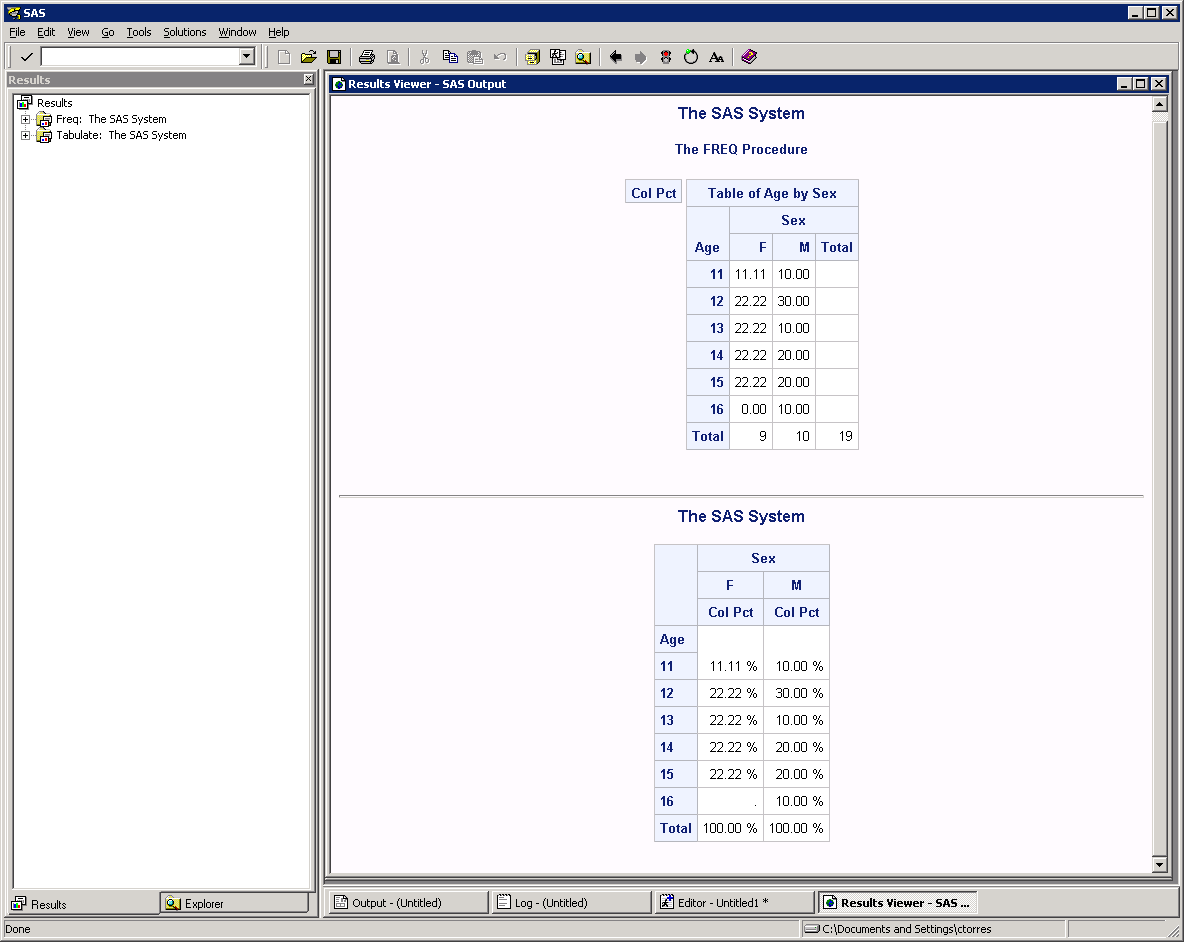
Consider using Proc TABULATE insted which gives you many more formating options than Proc FREQ.
Compare the reports produced by the following two sample codes:
1. Using Proc FREQ:
proc freq data=sashelp.class;
tables age*sex / nopercent norow nofreq;
run;
2. Using Proc FORMAT ans Proc TABULATE:
proc format;
picture pctfmt low-high='009.99 %';
run;
proc tabulate data=sashelp.class format=10.;
class age sex;
table age all , sex*colpctn*F=pctfmt10.;
keylabel all='Total' colpctn='Col Pct';
run;
CTorres
- Mark as New
- Bookmark
- Subscribe
- Mute
- RSS Feed
- Permalink
- Report Inappropriate Content
Thank you very much for introducing me to proc tabulate.
The website that has proven to be most helpful is:
.jpg")
Catch up on SAS Innovate 2026
Nearly 200 sessions are now available on demand in the Innovate Hub.
Watch Now →Learn the difference between classical and Bayesian statistical approaches and see a few PROC examples to perform Bayesian analysis in this video.

Find more tutorials on the SAS Users YouTube channel.
SAS Training: Just a Click Away
Ready to level-up your skills? Choose your own adventure.
-
2 replies
-
12-29-2014 10:26 AM
-
1887 views
-
0 likes
-
2 in conversation
-
