- Home
- /
- Programming
- /
- SAS Procedures
- /
- Re: Calculating rolling correlations and output each correlation matri...
- RSS Feed
- Mark Topic as New
- Mark Topic as Read
- Float this Topic for Current User
- Bookmark
- Subscribe
- Mute
- Printer Friendly Page

- Mark as New
- Bookmark
- Subscribe
- Mute
- RSS Feed
- Permalink
- Report Inappropriate Content
An excerpt of my data looks like this:
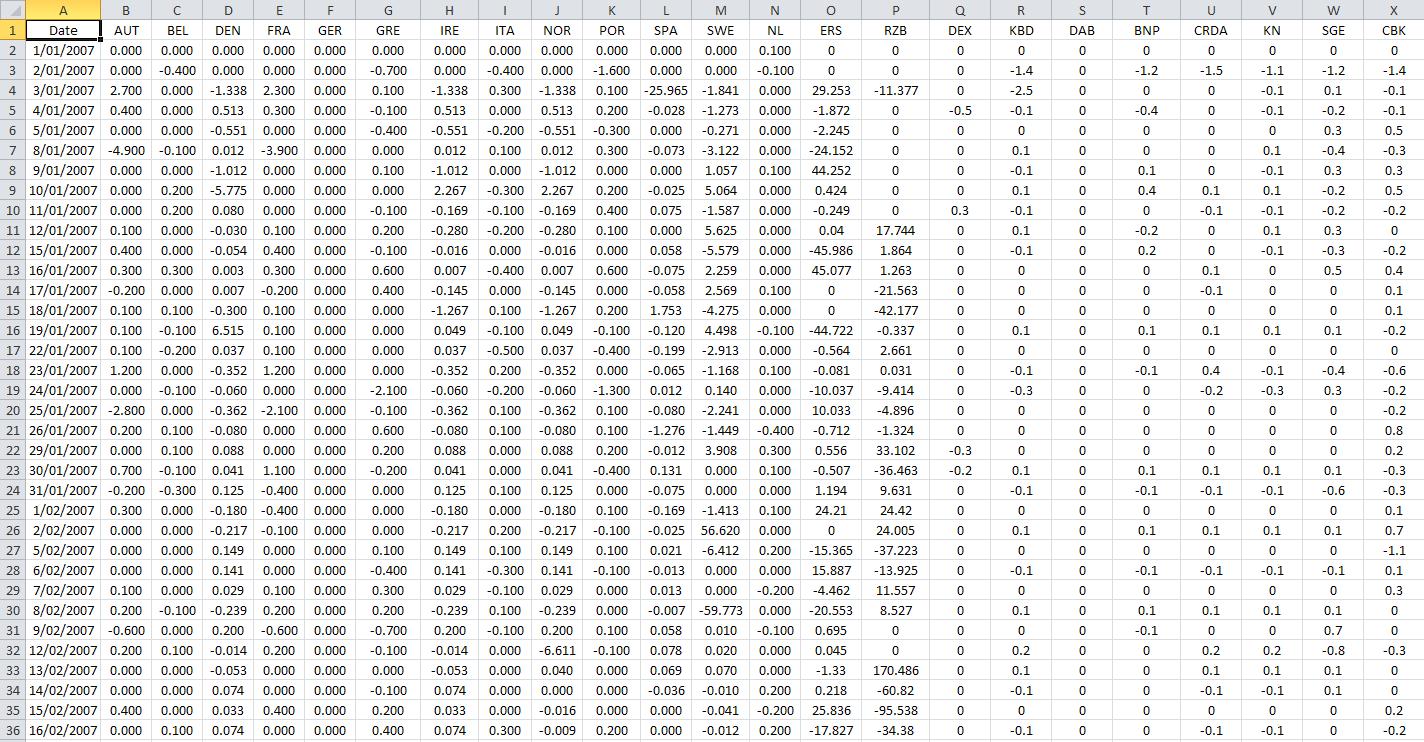
(For an enlarged version: http://puu.sh/79NCK.jpg and for the full dataset: Dropbox - data_rolling.xlsx)
There are no missing values in my dataset.
I wish to calculate the correlation matrix using a rolling window of 1 year. My period starts from 01 Jan 2008 to 31 Dec 2013. So for example, the correlation between AUT and BEL on 01 Jan 2008 is calculated using the series of values from 01 Jan 2007 to 01 Jan 2008, and likewise for all other pairs. Similarly the correlation between AUT and BEL on 02 Jan 2008 is calculated using the series of values from 02 Jan 2007 to 02 Jan 2008.
Since there will be a different correlation matrix for each day, I want to output each day's correlation matrix into a sheet in excel and name that sheet COV1 (for 01 Jan 2008), COV2 (for 02 Jan 2008), COV3 (for 03 Jan 2008), and so on until COV1566 (for 31 Dec 2013). An excerpt of the output that I am after for each sheet is like this: (Note: with the titles included on the top row and first column)
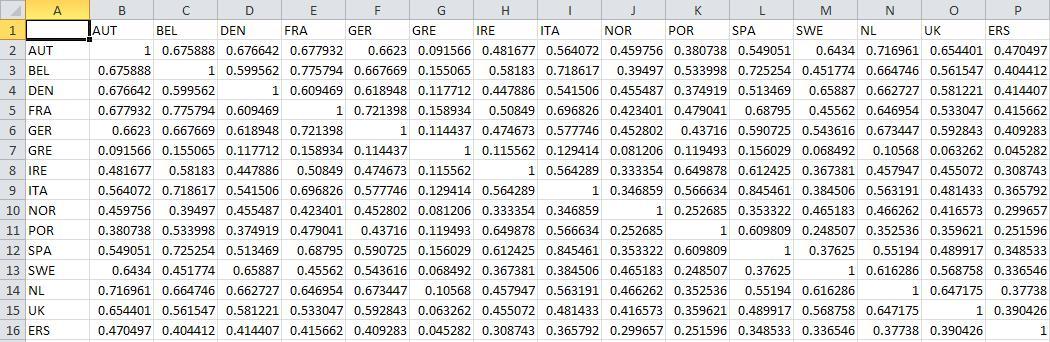
(For enlarged versionL http://puu.sh/79NAy.jpg)
I have loaded my datafile into SAS named 'rolling'. For the moment, my code is simply:
proc corr data = mm.rolling;
run;
Which simply calculates the correlation matrix using the entire series of values. Since I am very new to SAS, I am not sure what to do next, any help would be appreciated.

- Mark as New
- Bookmark
- Subscribe
- Mute
- RSS Feed
- Permalink
- Report Inappropriate Content
Hi,
Create a macro which receives as input a date. This macro will be run once for each 1566 dates.
In that macro first subset your data set with values relevant to the date. Like if date passed is 01 Jan 2008 , the subset should be all the records with date between 01 Jan 2008 & 01 Jan 2007.
Then Use this temporary data set in your Correlation function.
Then Use ODS for creating an excel file for the output of correlation.
Include the macro in a loop which runs for each of the dates.
Vishal
- Mark as New
- Bookmark
- Subscribe
- Mute
- RSS Feed
- Permalink
- Report Inappropriate Content
Thanks for those guidelines, I'm not too sure how to practically implement this, could you outline somewhat of a skeleton-code for me? Greatly appreciated.

- Mark as New
- Bookmark
- Subscribe
- Mute
- RSS Feed
- Permalink
- Report Inappropriate Content
I don't think a macro loop is the way to go for this problem. It would be "better" to expand the data into the groups of rolling one year groups of observations. The way you do that depends on your skills mine are limited so I use simple methods. You might want to give more info on how you want to handle the 1500+ correlation matrices. My PROC CORR below does not address that and sending all that to the output window will not be good.
data rollin;
do roll=1 by 1;
point1=roll;
set roll(keep=date rename=(date=date1)) point=point1;
target = intnx('Year',date1,1,'S')-1;
do point2=roll by 1 while(date lt target);
set roll point=point2;
if _error_ then do;
_error_=0;
stop;
end;
output;
end;
end;
stop;
format target date9.;
drop date1;
run;
sasfile roll close;
proc corr data=rollin;
by roll target;
where roll le 2;
var aut--stanbs;
ods select PearsonCorr;
run;
- Mark as New
- Bookmark
- Subscribe
- Mute
- RSS Feed
- Permalink
- Report Inappropriate Content
So I have managed to kinda get the following code but I don't think it's right, for example, the output contains missing values even though my dataset doesn't have any missing values. Also, I am not sure how to specify the output so that it is in order according to the "to" date, that is, the first correlation matrix should be for the day 01JAN08, the second should be for 02JAN08, etc. Currently, the output doesn't follow this order. Any modifications would be appreciated.
%macro rollingCorrelations(inputDataset=, refDate=);
/*first get a list of unique dates on or after the reference date*/
proc freq data = &inputDataset. noprint;
where date >="&refDate."d;
table date/out = dates(keep = date);
run;


/*for each date calculate what the window range is, here using a year's length*/
data dateRanges(drop = date);
set dates end = endOfFile
  nobs= numDates;
format toDate fromDate date9.;

toDate=date;
fromDate = intnx('year', toDate, -1, 's');

call symputx(compress("toDate"!!_n_), put(toDate,date9.));
call symputx(compress("fromDate"!!_n_), put(fromDate, date9.) );

/*find how many times(numberOfWindows) we need to iterate through*/
if endOfFile then do;
call symputx("numberOfWindows", numDates);
end;

run;
%do i = 1 %to &numberOfWindows.;
/*create a temporary view which has the filtered data that is passed to PROC CORR*/
data windowedDataview / view = windowedDataview;
set &inputDataset.;
where date between "&&fromDate&i."d and "&&toDate&i."d;
drop date;
run;
  /*the output dataset from each PROC CORR run will be
correlation_DDMMMYYY<from date>_DDMMMYY<start date>*/
proc corr data = windowedDataview
outp = correlations_&&fromDate&i.._&&toDate&i. (where=(_type_ = 'CORR'))

  noprint;
run;

%end;

/*append all datasets into a single table*/
data all_correlations;
format from to date9.;
set correlations_:
  indsname = datasetname
;
from = input(substr(datasetname,19,9),date9.);
to = input(substr(datasetname,29,9), date9.);
run;


%mend rollingCorrelations;
%rollingCorrelations(inputDataset=rolling, refDate=01JAN2008)
- Mark as New
- Bookmark
- Subscribe
- Mute
- RSS Feed
- Permalink
- Report Inappropriate Content
Hi,
I have tried to work out using Sample data.
data sample;
input dates mmddyy8. a b;
format dates mmddyy10.;
datalines;
01/01/09 1 5
01/11/09 2 2
01/21/09 4 6
01/31/09 2 3
02/10/09 5 7
02/20/09 7 1
03/02/09 3 5
03/02/10 8 2
03/03/10 2 7
03/13/10 8 3
03/23/10 3 7
04/2/10 5 2
04/12/10 3 7
04/12/11 5 4
04/22/11 4 5
05/02/11 6 2
05/12/11 2 7
05/22/11 7 6
06/01/11 4 8
06/11/11 5 3
06/21/11 8 3
;
proc sort data = sample;
by dates;
run;
/* Finding Unique dates more than 01/01/2010 which have atleast one year of history data*/
data unique_dates;
set sample (keep = dates);
by dates ;
if dates > = input("01/01/10" , mmddyy8.);
if first.dates then output;
run;
/* Passing each date in the macro for finding correlation for that particular date based on data
for last one year from that date*/
data _null_;
set unique_dates;
call symput("value",put(dates,mmddyy8.));
%macro_process(value);
%put &value;
run;
%macro macro_process(value);
data subset;
set sample ;
/* Subsetting Data for last one year from the particular date*/
if dates < = intnx('year',input("&value",mmddyy8. ),-1) then output;
run;
/*Running Correlation proc for particular date and relevant data*/
proc corr data = subset (drop = dates);
run;
%mend macro_subset(value);
/*Each of the Correlation output can be saved in any form using ODS*/
Vishal
- Mark as New
- Bookmark
- Subscribe
- Mute
- RSS Feed
- Permalink
- Report Inappropriate Content
Thanks Vishal, that works well. I just realised there is one more remaining problem which I'm not too sure how to code.
Using my original dataset (in my first post), an excerpt of the output (using the code in my third post) can be found https://www.dropbox.com/s/9f7fdrq4rt72lwt/output.xlsx
As can be seen row 2 to row 53 presents the correlation matrix for the day 1 Apr 2008. However, a problem arises for the correlation matrix for the day 1 Apr 2009: there are missing values for correlation coefficients for ALPHA and its pairs. This is because if one looks at the datafile, the values for ALPHA from 1 Apr 2008 to 1 Apr 2009 are all zero, hence causing a division by zero when SAS tries to calculate the correlation coefficient. This situation happens with a few other data values too, for example, HSBC also has all values as 0 from 1 Apr 08 to 1 Apr 09.
To resolve this issue, I was wondering how the above code can be modified so that in cases where this situation happens (i.e., all values are 0 between two certain dates), then the correlation between the two pairs of data values are simply calculated using the WHOLE sample period. E.g., the correlation between ALPHA and AUT is missing on 1 Apr 09, then this correlation should be calculated using the values from 1 JAN 2008 to 31 DEC 2013, rather than using the values from 1 Apr 08 to 1 Apr 09.
Thank you.
.jpg")
Catch up on SAS Innovate 2026
Nearly 200 sessions are now available on demand with the SAS Innovate Digital Pass.
Explore Now →Learn the difference between classical and Bayesian statistical approaches and see a few PROC examples to perform Bayesian analysis in this video.

Find more tutorials on the SAS Users YouTube channel.
SAS Training: Just a Click Away
Ready to level-up your skills? Choose your own adventure.
-
6 replies
-
02-25-2014 04:31 AM
-
9106 views
-
0 likes
-
3 in conversation
-
