- Home
- /
- Programming
- /
- SAS Procedures
- /
- Re: Add computed column under across variable
- RSS Feed
- Mark Topic as New
- Mark Topic as Read
- Float this Topic for Current User
- Bookmark
- Subscribe
- Mute
- Printer Friendly Page
- Mark as New
- Bookmark
- Subscribe
- Mute
- RSS Feed
- Permalink
- Report Inappropriate Content
Hi,
This is my sample data
data sales;
input zone $ sub_zone $ sale_month $ product $ sales;
datalines;
East East1 201501 Product1 100
East East2 201501 Product1 350
East East1 201502 Product1 200
East East2 201502 Product1 200
West West1 201501 Product1 100
West West2 201501 Product1 550
West West1 201502 Product1 150
West West2 201502 Product1 200
East East1 201501 Product2 350
East East2 201501 Product2 250
East East1 201502 Product2 300
East East2 201502 Product2 200
West West1 201501 Product2 200
West West2 201501 Product2 250
West West1 201502 Product2 300
West West2 201502 Product2 400
;
run;
and I'm trying to create report like below:

With below code I'm able to create this report except the "Max" column which is the max of values of Product sale.
Proc report data=sales missing headline;
column zone sub_zone sale_month,product,sales;
define zone / group width= 10 'Zone';
define sub_zone / group width= 10 'Sub-Zone';
define sale_month / across '';
define product / across '';
define sales / analysis sum format=4.0 '';
run;
quit;
Can any one please guide me on how to add a computed column under across variable?
Thanks in advance!!
Accepted Solutions
- Mark as New
- Bookmark
- Subscribe
- Mute
- RSS Feed
- Permalink
- Report Inappropriate Content
Hi:
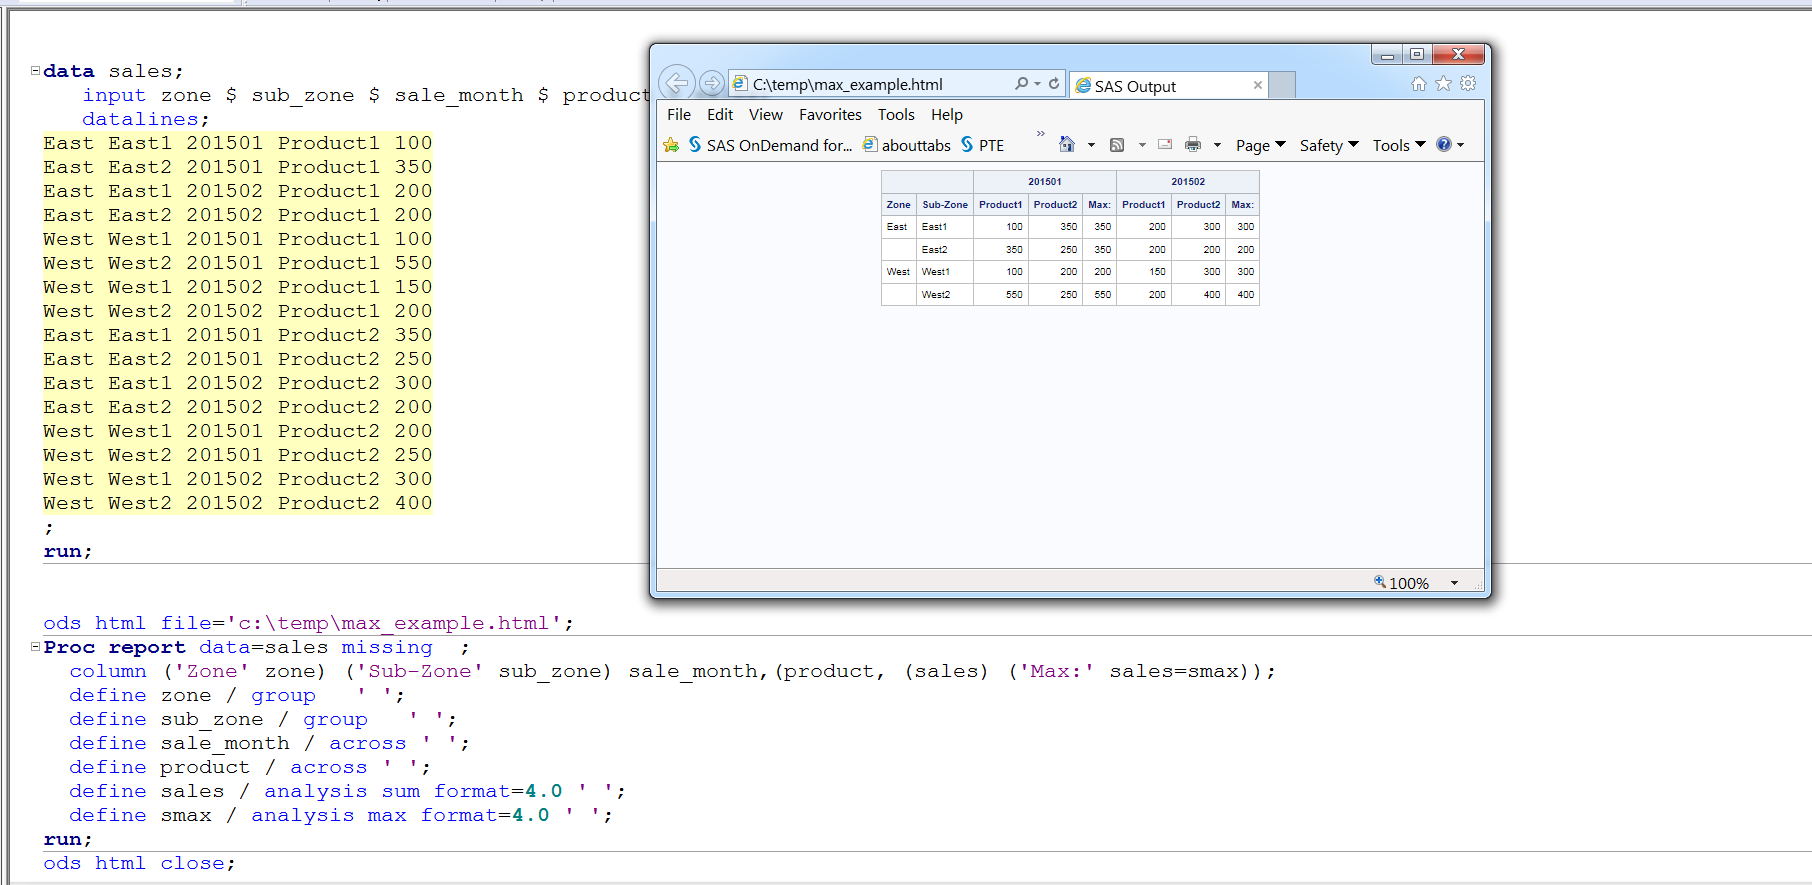
First, you don't need a computed column or an SQL step. You can use PROC REPORT to do everything through the use of ALIASES. SALES can be used for the SUM statistic and can also be used for the MEAN statistic, as shown below.
cynthia

- Mark as New
- Bookmark
- Subscribe
- Mute
- RSS Feed
- Permalink
- Report Inappropriate Content
This isn't exact but it's close, see if this works or if you can manipulate it for your needs. I'm getting the max before the proc report:
data have;
input zone $ sub_zone $ sale_month $ product $ sales;
datalines;
East East1 201501 Product1 100
East East2 201501 Product1 350
East East1 201502 Product1 200
East East2 201502 Product1 200
West West1 201501 Product1 100
West West2 201501 Product1 550
West West1 201502 Product1 150
West West2 201502 Product1 200
East East1 201501 Product2 350
East East2 201501 Product2 250
East East1 201502 Product2 300
East East2 201502 Product2 200
West West1 201501 Product2 200
West West2 201501 Product2 250
West West1 201502 Product2 300
West West2 201502 Product2 400
;
proc sql;
create table want as
select *,max(sales) as max
from have
group by zone,sub_zone,sale_month;
Proc report data=want missing headline;
column zone sub_zone sale_month,product,sales sale_month,product,max;
define zone / group width= 10 'Zone';
define sub_zone / group width= 10 'Sub-Zone';
define sale_month / across '';
define product / across '';
define sales / analysis sum format=4.0 '';
define max / group width= 3 'Max';
- Mark as New
- Bookmark
- Subscribe
- Mute
- RSS Feed
- Permalink
- Report Inappropriate Content
Hi:
First, you don't need a computed column or an SQL step. You can use PROC REPORT to do everything through the use of ALIASES. SALES can be used for the SUM statistic and can also be used for the MEAN statistic, as shown below.
cynthia

- Mark as New
- Bookmark
- Subscribe
- Mute
- RSS Feed
- Permalink
- Report Inappropriate Content
April 27 – 30 | Gaylord Texan | Grapevine, Texas
Registration is open
Walk in ready to learn. Walk out ready to deliver. This is the data and AI conference you can't afford to miss.
Register now and lock in 2025 pricing—just $495!
Learn the difference between classical and Bayesian statistical approaches and see a few PROC examples to perform Bayesian analysis in this video.
Find more tutorials on the SAS Users YouTube channel.
SAS Training: Just a Click Away
Ready to level-up your skills? Choose your own adventure.


