- RSS Feed
- Mark Topic as New
- Mark Topic as Read
- Float this Topic for Current User
- Bookmark
- Subscribe
- Mute
- Printer Friendly Page

- Mark as New
- Bookmark
- Subscribe
- Mute
- RSS Feed
- Permalink
- Report Inappropriate Content
hi
i need your help to correct this simulation program in sas multivariate binary data .
regards
%include "C:\Users\hp\Desktop\RandMVBinary.sas";
proc iml;
load module=_all_; /* load the modules */
p = {0.25 0.75 0.5 0.25 0.30 0.10 0.30 0.55 0.25 0.65}; /* expected values of the X
Delta = {1 0.45 0.4 0.35 0.3 0.25 0.2 0.15 0.1 0.05,
0.45 1 0.45 0.4 0.35 0.3 0.25 0.2 0.15 0.1,
0.4 0.45 1 0.45 0.4 0.35 0.3 0.25 0.2 0.15,
0.35 0.4 0.45 1 0.45 0.4 0.35 0.3 0.25 0.2,
0.3 0.35 0.4 0.45 1 0.45 0.4 0.35 0.3 0.25,
0.25 0.3 0.35 0.4 0.45 1 0.45 0.4 0.35 0.3,
0.2 0.25 0.3 0.35 0.4 0.45 1 0.45 0.4 0.35,
0.15 0.2 0.25 0.3 0.35 0.4 0.45 1 0.45 0.4,
0.1 0.15 0.2 0.25 0.3 0.35 0.4 0.45 1 0.45,
0.05 0.1 0.15 0.2 0.25 0.3 0.35 0.4 0.45 1};
X = RandMVBinary(1000, p, Delta);
/* compare sample estimates to parameters */
print p, Delta;
create MVbinary from X; append from X; close MVB;
quit;
- Mark as New
- Bookmark
- Subscribe
- Mute
- RSS Feed
- Permalink
- Report Inappropriate Content
Hi all
I hope anyone answer me to correct the previous program please. Regards

- Mark as New
- Bookmark
- Subscribe
- Mute
- RSS Feed
- Permalink
- Report Inappropriate Content
Your problem is explained in Section 9.2 of Simulating Data with SAS, pp 154--157. The program gives you hints to fix it. When you run the program, the RandMVBinary module prints the message:
- The specified covariance is invalid
and displays the lower and upper bounds for a valid covariance matrix.Your Delta matrix must be within these bounds.
For your example, the following correlations (and their symmetric partners) are invalid because they are too large:
(1,2) (2,4) (2,6) (3,6) (6,8) (6,10) (9,10)
Even after you fix that problem, you still might run into difficulties because, as I have told you many times, it is extremely difficult to "invent" a mean vector and a covariance matrix that represents a valid set of parameters for generating 10 correlated multivariate binary or ordinal variables. There are complex relationships between the means and the covariances that render many combinations invalid, and you can't tell which matrices are invalid by looking at them. It is not until you try to run the program and get an error that you are alerted to the fact that you have specified invalid parameters.
The problem is especially difficult for highly correlated variables. If you just want ANY matrix that works, try halving the size of the correlations that you are using. (This is an example of what the literature calls "shrinkage".) By trial and error, I discovered that the following correlation matrix works:
Delta = {
1 0.15 0.2 0.175 0.15 0.125 0.1 0.075 0.05 0.025,
0.15 1 0.225 0.15 0.175 0.075 0.125 0.1 0.075 0.05 ,
0.2 0.225 1 0.225 0.2 0.15 0.15 0.125 0.1 0.075,
0.175 0.15 0.225 1 0.225 0.2 0.175 0.15 0.125 0.1 ,
0.15 0.175 0.2 0.225 1 0.225 0.2 0.175 0.15 0.125,
0.125 0.075 0.15 0.2 0.225 1 0.225 0.125 0.175 0.1 ,
0.1 0.125 0.15 0.175 0.2 0.225 1 0.225 0.2 0.175,
0.075 0.1 0.125 0.15 0.175 0.125 0.225 1 0.225 0.2 ,
0.05 0.075 0.1 0.125 0.15 0.175 0.2 0.225 1 0.2 ,
0.025 0.05 0.075 0.1 0.125 0.1 0.175 0.2 0.2 1 };
- Mark as New
- Bookmark
- Subscribe
- Mute
- RSS Feed
- Permalink
- Report Inappropriate Content
thank you so much dr. rick exactly the delta matrix is work and i got on a results i will try to find more about mvbinary data.
- Mark as New
- Bookmark
- Subscribe
- Mute
- RSS Feed
- Permalink
- Report Inappropriate Content
hi
when i simulate data with multivariate binary the results will be ordered or unordered binary data.
thanks in advance
- Mark as New
- Bookmark
- Subscribe
- Mute
- RSS Feed
- Permalink
- Report Inappropriate Content
Th observations are generated in a random order.
- Mark as New
- Bookmark
- Subscribe
- Mute
- RSS Feed
- Permalink
- Report Inappropriate Content
you means unordered variables??
- Mark as New
- Bookmark
- Subscribe
- Mute
- RSS Feed
- Permalink
- Report Inappropriate Content
hi
i have same problem when i want to simulate multi different sample in mvbinary.
%include "RandMVBinary.sas";
proc iml;
load module=_all_; /* load the modules */
p = {0.25 0.75 0.5 0.25 0.30 0.10 0.30 0.55 0.25 0.65}; /* expected values of the X
Delta = {1 0.15 0.2 0.175 0.15 0.125 0.1 0.075 0.05 0.025,
0.15 1 0.225 0.15 0.175 0.075 0.125 0.1 0.075 0.05 ,
0.2 0.225 1 0.225 0.2 0.15 0.15 0.125 0.1 0.075,
0.175 0.15 0.225 1 0.225 0.2 0.175 0.15 0.125 0.1 ,
0.15 0.175 0.2 0.225 1 0.225 0.2 0.175 0.15 0.125,
0.125 0.075 0.15 0.2 0.225 1 0.225 0.125 0.175 0.1 ,
0.1 0.125 0.15 0.175 0.2 0.225 1 0.225 0.2 0.175,
0.075 0.1 0.125 0.15 0.175 0.125 0.225 1 0.225 0.2 ,
0.05 0.075 0.1 0.125 0.15 0.175 0.2 0.225 1 0.2 ,
0.025 0.05 0.075 0.1 0.125 0.1 0.175 0.2 0.2 1 };
/* loop approach */
NumSamples = 2;
call randseed(54321);
do i = 1 to NumSamples;
X = RandMVOBinary(500, P, Delta);
/* do something with each sample */
end;
/* compare sample estimates to parameters */
print p, Delta;
create MVbinary from X; append from X; close MVB;
quit;
thanks in advance

- Mark as New
- Bookmark
- Subscribe
- Mute
- RSS Feed
- Permalink
- Report Inappropriate Content
Hi Rick,
Sorry I have to reply here. I posted a question in the community discussion but have not received any response since
then. So here’s my question.
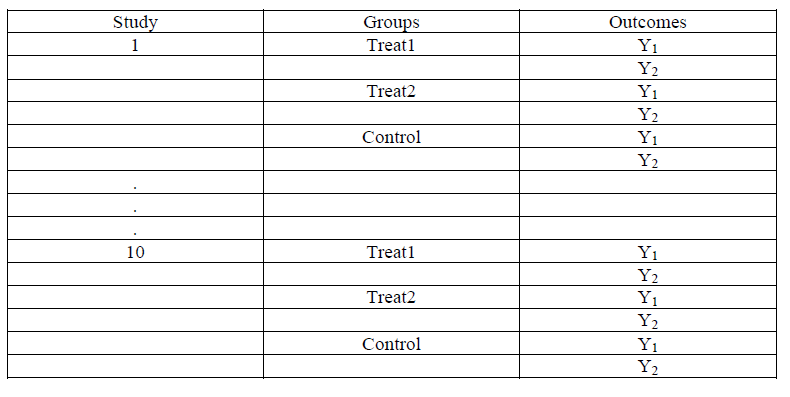
I want to generate raw data for a study that has multiple treatment groups (2 treatment groups and 1 control group). Every participant in each of the groups are measured on two related outcomes ( r=.80). Then I need to repeat the same process to generate 10 studies, which I plan to meta-analyze. Each group has equal sample size (n=10). Any help with the simulation code will be
appreciated. Outcomes are generated from a multivariate normal distribution. The table below illustrates how the data should look like.
Thanks,
Rommel
.jpg")
Catch up on SAS Innovate 2026
Nearly 200 sessions are now available on demand in the Innovate Hub.
Watch Now →- Live Webinar: Unlocking Value With Managed Cloud Services | 16-Jun-2026
- Ask the Expert: Can Agents Reduce Planning Friction in CPG Supply Chains? | 16-Jun-2026
- Ask the Expert: Mit KI zur Höchstleistung: SAS Studio Copilot in Aktion! | 25-Jun-2026
- Ask the Expert: Get Meaningful Results With New Features in SAS Customer Intelligence 360 | 25-Jun-2026
- Ask the Expert: Modern, offen, skalierbar: Datenarchitektur mit SAS®Viya | 09-Jul-2026
- MinnSUG 2026 Annual SAS Conference | 22-Jul-2026
-
8 replies
-
01-07-2014 10:39 AM
-
6262 views
-
0 likes
-
3 in conversation
-
