Hello,
I have posted a question on the macro and DATA step forum, which is related do simulations, and more precisely to a simulation from Rick Wicklin's book, so I was advised to post it here although it's not really about IML or matrices.
I bought the "Simulating Data with SAS book". I am relatively new to SAS programming (although was using SAS for analysis for some time), and wishes to improve my SAS skills, in particular the ones required for the clinical world.
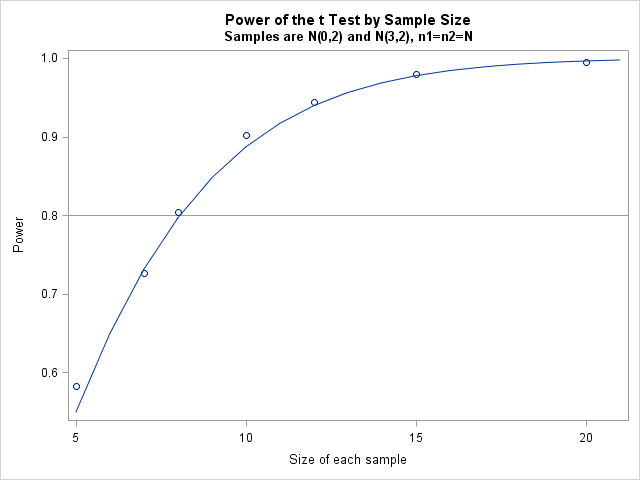
I read the program in section 5.4.2 about simulating the power of the t-test. The program assumes varying effect sizes. I wanted to change the code so it will suit varying sample sizes rater than effect sizes (it would be ideal if both could vary but this is complicated).
After fixing my code several times because I got it wrong, I finally got results which are almost identical to the ones of the power proc. However, in page 86 in the book there is a graph. When I ran Rick's code, I got this graph too. After I changed the program, the line disappeared, only the dots were presented. When I changed the series x=N y=p, I got a line, that connects my points, but it wasn't the line of proc power. When I keep it as series x=N y=Power, I get dots only. I can't figure out why, I tried comparing the output files, the structure looked identical.
My next stage will be to try and simulate power for other statistical tests and models, I will try and most likely ask a few questions in the future. My ideal goal will be to create a small library of power analysis code for several situations (superiority, non-inferiority, equivalence) of different variables (continuous, binary, time to event, ...).
Thank you !
proc power;
twosamplemeans power = .
meandiff = 3
stddev = 2
ntotal=10 to 40 by 10;
plot x=N markers=none;
ods output Output=Power;
run;
data PowerSim(drop=i);
call streaminit(321);
do N = 5 to 20 by 5;
do SampleID = 1 to 10000;
c = 1;
do i = 1 to N;
x1 = rand("Normal", 0, 2);
output;
end;
c = 2;
do i = 1 to N;
x1 = rand("Normal", 3, 2);
output;
end;
end;
end;
run;
proc ttest data=PowerSim;
by N SampleID;
class c;
var x1;
ods output ttests=TTests(where=(method="Pooled"));
run;
data Results;
set TTests;
RejectH0 = (Probt le 0.05);
run;
proc freq data=Results noprint;
by N;
tables RejectH0 / out=SimPower(where=(RejectH0=1));
run;
data Combine;
set SimPower Power;
p = percent / 100;
label p="Power";
run;
proc sgplot data=Combine noautolegend;
title "Power of the t Test";
title2 "Samples are N(0,stdev) and N(delta,stdev)";
series x=N y=Power;
scatter x=N y=p;
xaxis label="Sample size";
run;


.jpg")
