- Home
- /
- Programming
- /
- Graphics
- /
- Re: How to create 100 percent stacked Bar chart using GTL?
- RSS Feed
- Mark Topic as New
- Mark Topic as Read
- Float this Topic for Current User
- Bookmark
- Subscribe
- Mute
- Printer Friendly Page

- Mark as New
- Bookmark
- Subscribe
- Mute
- RSS Feed
- Permalink
- Report Inappropriate Content
Hi ,
I want to generate a 100 percent stacked Bar chart using GTL Code?
PFA attachment for the expected output from GTL.
Can anyone help me in setting up the code ?
Thanks

Accepted Solutions

- Mark as New
- Bookmark
- Subscribe
- Mute
- RSS Feed
- Permalink
- Report Inappropriate Content
You have to make the data summary with the percent calculated within each group first.
by origin;
run;
proc freq data=cars noprint;
by origin;
tables type / out=g100;
run;
proc print;
run;
proc template;
define statgraph bar100;
begingraph;
layout overlay;
BARCHARTPARM X = origin y=percent / group=type;
endlayout;
endgraph;
end;
run;
proc sgrender data=g100 template=bar100;
run;
- Mark as New
- Bookmark
- Subscribe
- Mute
- RSS Feed
- Permalink
- Report Inappropriate Content
In 's blog he uses SGPLOT but I reckon you can do the same with GTL.
http://blogs.sas.com/content/graphicallyspeaking/2014/04/06/g100-with-sgplot/
- Mark as New
- Bookmark
- Subscribe
- Mute
- RSS Feed
- Permalink
- Report Inappropriate Content
Hi,
Thanks.
But I want the options\statment in PROC TEMPLATE.... BARCHART statement..? Not using SGPLOT or GCHART.
- Mark as New
- Bookmark
- Subscribe
- Mute
- RSS Feed
- Permalink
- Report Inappropriate Content
RTM. I did not intend to "like" your reply but I don't know how to "unlike".:smileyplain:
TMPLOUT=“filename”
writes the Graph Template Language code for your graph to a file.

- Mark as New
- Bookmark
- Subscribe
- Mute
- RSS Feed
- Permalink
- Report Inappropriate Content
Due to its popularity, an option to do a "G100" like bar chart will be added to GTL and SG procedures soon.
- Mark as New
- Bookmark
- Subscribe
- Mute
- RSS Feed
- Permalink
- Report Inappropriate Content
Just an FYI...
Dan just reminded me that G100 feature has been added to SGPLOT procedure with SAS 9.4. User PCTLEVEL=GROUP;
sgplot data=sashelp.cars pctlevel=group;
vbar origin / group=type stat=pct;
run;

- Mark as New
- Bookmark
- Subscribe
- Mute
- RSS Feed
- Permalink
- Report Inappropriate Content
try this one :
- Mark as New
- Bookmark
- Subscribe
- Mute
- RSS Feed
- Permalink
- Report Inappropriate Content
Hi All,
Thanks for your replies.
The below is the code which I tried to generate 100% stacked bar chart without Y axis and below is the output which I got.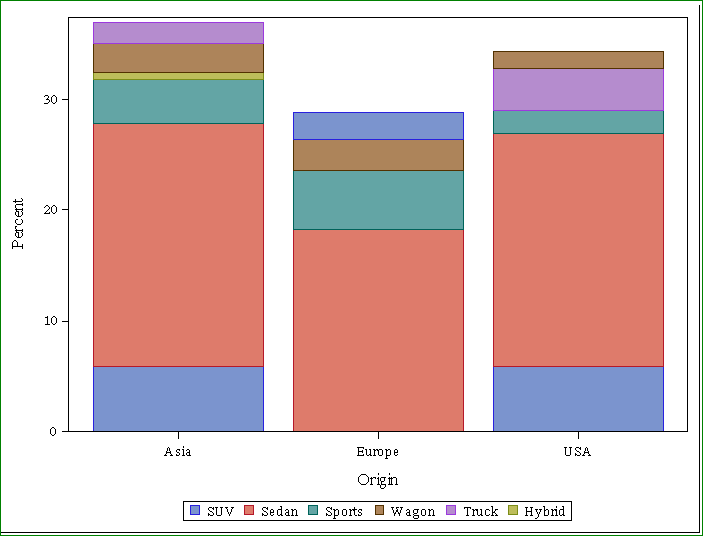
proc template;
define statgraph bar100;
begingraph;
layout overlay;
barchart x=Origin /group=type
stat=pct;
endlayout;
endgraph;
end;
run;
ods rtf file="c:temp\bar100.rtf";
proc sgrender data=sashelp.cars template=bar100;
run;
ods rtf close;
My expected Output is
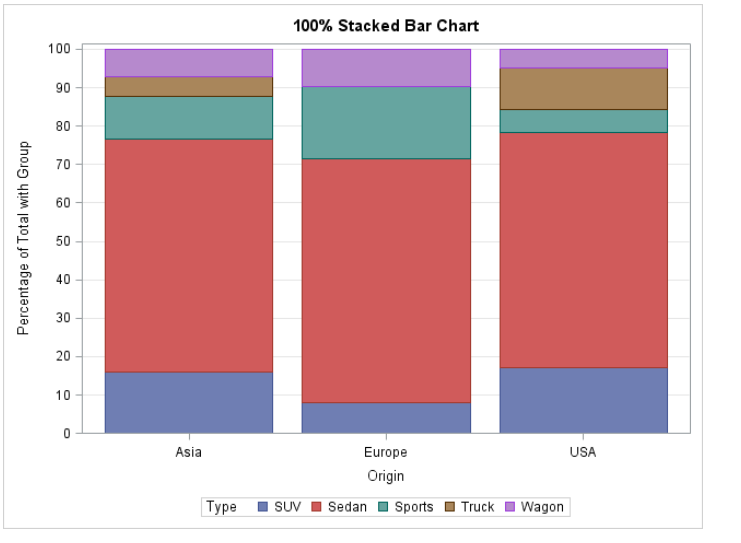
Please suggest me how to generate since I am new to SAS graph.
Thanks.
- Mark as New
- Bookmark
- Subscribe
- Mute
- RSS Feed
- Permalink
- Report Inappropriate Content
You have to make the data summary with the percent calculated within each group first.
by origin;
run;
proc freq data=cars noprint;
by origin;
tables type / out=g100;
run;
proc print;
run;
proc template;
define statgraph bar100;
begingraph;
layout overlay;
BARCHARTPARM X = origin y=percent / group=type;
endlayout;
endgraph;
end;
run;
proc sgrender data=g100 template=bar100;
run;
- Mark as New
- Bookmark
- Subscribe
- Mute
- RSS Feed
- Permalink
- Report Inappropriate Content
Hi,
I have one doubt.
Is it possible to give in BARCHART statement? or Do we need to use BARCHARTPARM ?
Does it make any difference in output since we are paasing the summarized data to the erender?

Register Today!
Join us for SAS Innovate 2025, our biggest and most exciting global event of the year, in Orlando, FL, from May 6-9. Sign up by March 14 for just $795.
Learn how use the CAT functions in SAS to join values from multiple variables into a single value.

Find more tutorials on the SAS Users YouTube channel.
SAS Training: Just a Click Away
Ready to level-up your skills? Choose your own adventure.
-
9 replies
-
04-21-2014 06:29 AM
-
5864 views
-
4 likes
-
4 in conversation
-
