Hello,
Updated with a real example:
I have a peculiar problem, I have ~1000 series that I have to forecast. The issue is each series has different start and end dates. I need to forecast 12 months from the end date. What is surprising to me is that when I run SAS forecast server, each series starts with the oldest date in all of the series and ends with a newest date of all the series.
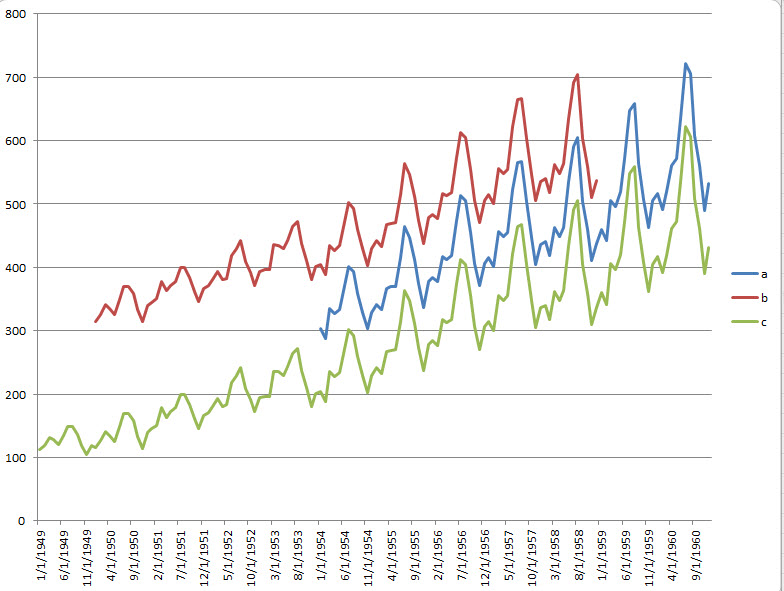
As an example lest suppose if we have 3 series (a,b and c) with different start and end dates as shown below:
| a | b | c |
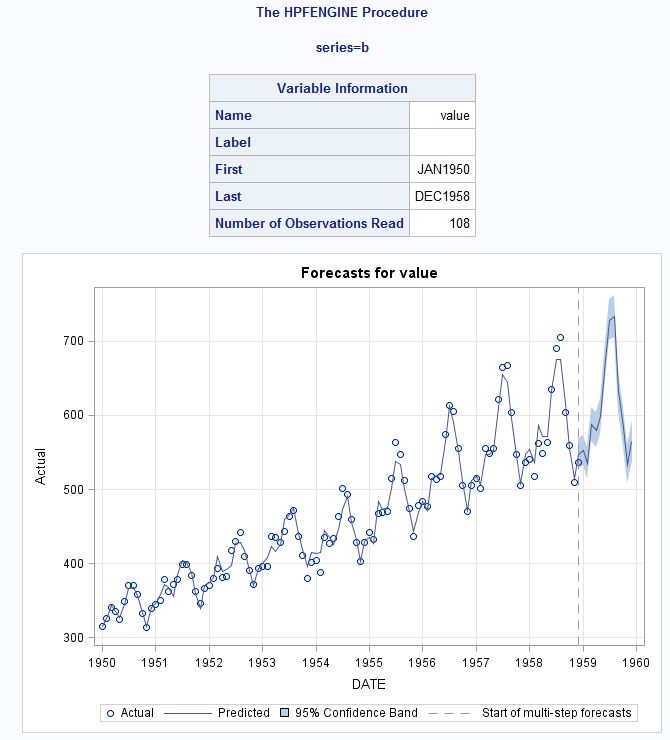
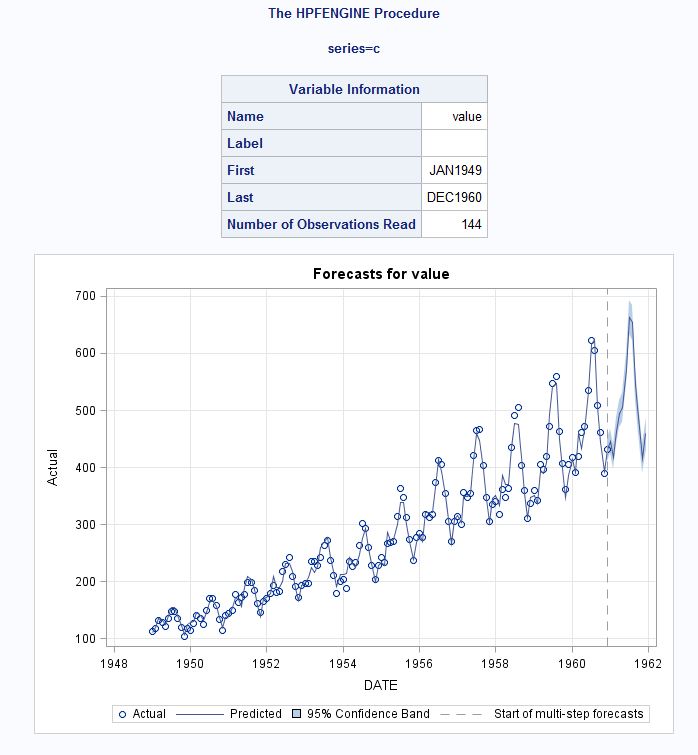
| Start Date | Jan-54 | Jan-50 | Jan-49 |
| End Date | Dec-60 | Dec-58 | Dec-60 |
| | | |
**********************************
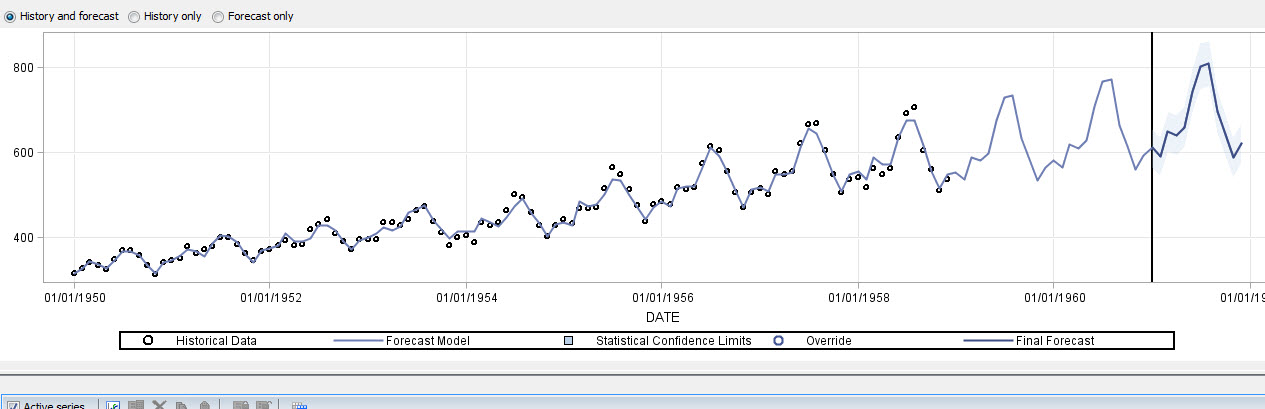
When I input this to SAS forecast server and set the forecast horizon to 12 months. SAS forecast server does not forecast the individual series (I deselected forecast hierarchy).
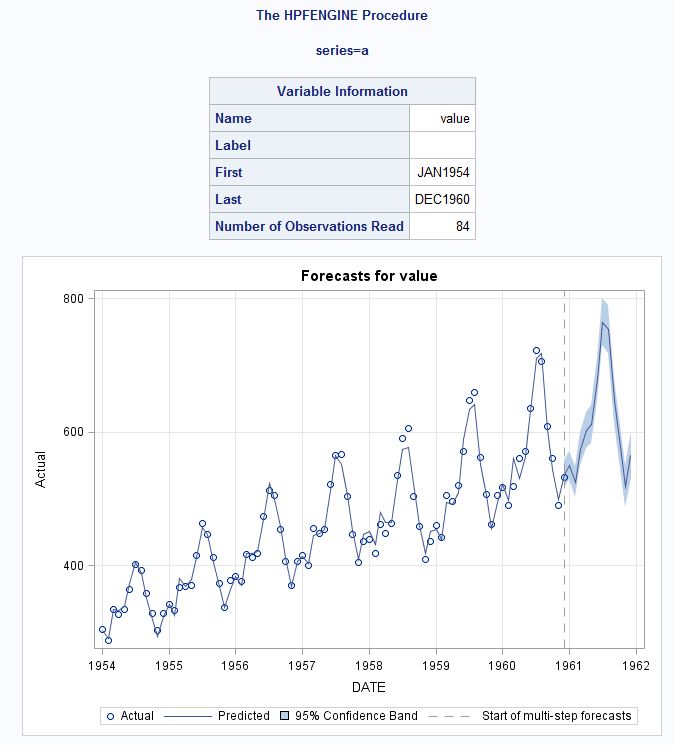
As an example My Series b, produces 36 months of forecast !!! See below. The forecast should have started in Jan 59 and ended in Dec 59 but as shown below the forecast ends in Dec 1961 which is the forecast end date of series c. How do I enforce SAS to forecast only 12 months and only forecast for end period in that series only?
Below are my questions:
- How to force forecast server to look into only dates for individual series as opposed to all the dates in the series.
- How to force forecast server to forecast only from the last date of the individual series
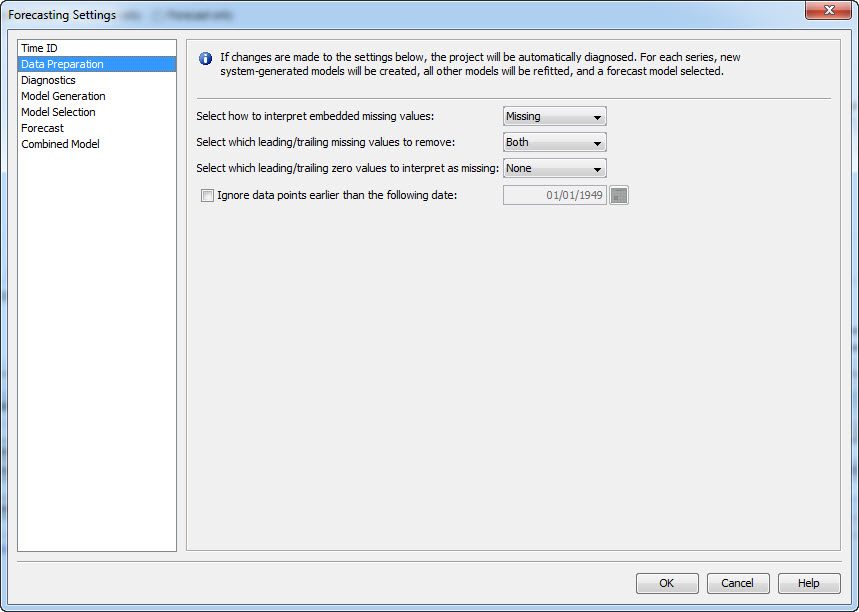
I figured out the missing values can be deleted by setting the following options. I'm not sure if there is a better version to do this ? Also attached is the csv files for replication.
Thanks so much


.jpg")
