- Home
- /
- Analytics
- /
- Forecasting
- /
- How to use ARIMA model to forecast a data series
- RSS Feed
- Mark Topic as New
- Mark Topic as Read
- Float this Topic for Current User
- Bookmark
- Subscribe
- Mute
- Printer Friendly Page

- Mark as New
- Bookmark
- Subscribe
- Mute
- RSS Feed
- Permalink
- Report Inappropriate Content
Hi Forum,
I have a variable named "ninety" in the attahced file. I need to forecast its values for maximum possible length ahead
as dictated by my 24 month's actual observations.
I have tried various methods such as moving average (3point, 12point), weighted moving average, exponential smoothing etc. but the Percent Absolue Deviation between predicted and actual values are way too high.
So, I tried ARIMA as the last resort.
Honestly I do not have any previous ARIMA expereince, so I have followed the SAS documentation mecahnically and followed the steps.
Question: I cannot run the last two steps to get the final forecasts. Could someone please help?
Thanks, Mirisage
/*taking the graph*/
ods graphics on;
proc sgplot data=test;
scatter y=ninety x=current_date;
run;
/*Analyzing correlation properties*/
proc arima data=test ;
identify var=ninety nlag=6;
run;
/*White Noise Test*/
proc arima data=test ;
identify var=ninety nlag=6;
run;
proc arima data=test ;
identify var=ninety nlag=5;
run;
proc arima data=test ;
identify var=ninety nlag=4;
run;
proc arima data=test ;
identify var=ninety nlag=3;
run;
/*Since the series is nonstationary, I transformed it to a stationary series by differencing.*/
/*Identification of the Differenced Series*/
proc arima data=test;
identify var=ninety(1);
run;
/*The autocorrelations decrease rapidly in this plot, indicating that the
change in ninety is a stationary time series. */
/*not running*/
proc arima data=test;
estimate p=1;
run;
/*Not running*/
/*forecasting*/
proc arima data=test;
forecast lead=12 interval=month id=date out=results;
run;
Accepted Solutions

- Mark as New
- Bookmark
- Subscribe
- Mute
- RSS Feed
- Permalink
- Report Inappropriate Content
Update: just noticed that my ARIMA code got truncated unfortunately - corrected it now.
Hello -
You might want to combine your last 3 PROC ARIMA calls into 1 call (and provide the correct name of your ID variable in the forecast statement):
proc arima data=test;
identify var=ninety(1);
estimate p=1;
forecast lead=12 interval=month id=current_date out=results;
run;
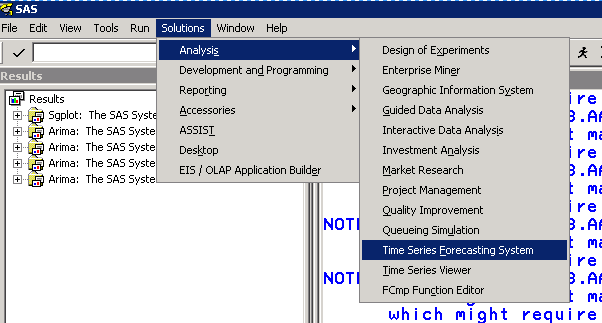
Since you have access to SAS/ETS it seems ![]() you could also feed your series to the Time Series Forecasting System:
you could also feed your series to the Time Series Forecasting System:
Start SAS on your machine and take advantage of the automatic model selection.
Documentation about TSFS can be found here:
http://support.sas.com/documentation/cdl/en/etsug/60372/HTML/default/viewer.htm#tfintro_toc.htm
BTW: your series seems to feature a level shift after Nov2010 - if you can explain why this might be good modeling information:
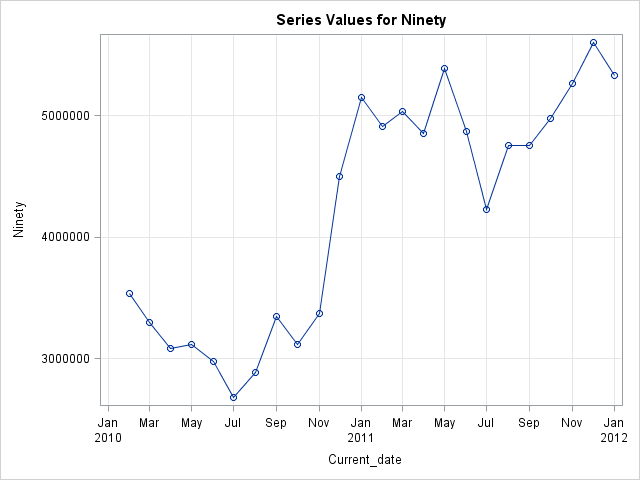
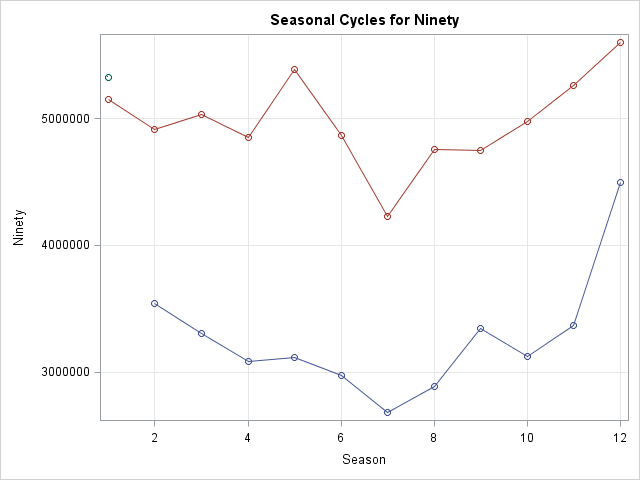
To replicate the graphics above use the following code (you might want to experiment with the plot features of this ETS procedure as well):
proc timeseries data=test out=_null_ plot=(series cycles);
id current_date interval=month;
var ninety;
run;
Thanks,
Udo
- Mark as New
- Bookmark
- Subscribe
- Mute
- RSS Feed
- Permalink
- Report Inappropriate Content
Hi Udo,
If you have time, could you please have a look on this ARIMA query. I really apprecaite.
Thank you
Mirisage
- Mark as New
- Bookmark
- Subscribe
- Mute
- RSS Feed
- Permalink
- Report Inappropriate Content
Update: just noticed that my ARIMA code got truncated unfortunately - corrected it now.
Hello -
You might want to combine your last 3 PROC ARIMA calls into 1 call (and provide the correct name of your ID variable in the forecast statement):
proc arima data=test;
identify var=ninety(1);
estimate p=1;
forecast lead=12 interval=month id=current_date out=results;
run;
Since you have access to SAS/ETS it seems ![]() you could also feed your series to the Time Series Forecasting System:
you could also feed your series to the Time Series Forecasting System:
Start SAS on your machine and take advantage of the automatic model selection.
Documentation about TSFS can be found here:
http://support.sas.com/documentation/cdl/en/etsug/60372/HTML/default/viewer.htm#tfintro_toc.htm
BTW: your series seems to feature a level shift after Nov2010 - if you can explain why this might be good modeling information:
To replicate the graphics above use the following code (you might want to experiment with the plot features of this ETS procedure as well):
proc timeseries data=test out=_null_ plot=(series cycles);
id current_date interval=month;
var ninety;
run;
Thanks,
Udo
- Mark as New
- Bookmark
- Subscribe
- Mute
- RSS Feed
- Permalink
- Report Inappropriate Content
Hi Udo,
Thank you very much for your great help.
Your help is very valuable for us.
Best regards
Mirisage
.jpg")
Catch up on SAS Innovate 2026
Nearly 200 sessions are now available on demand with the SAS Innovate Digital Pass.
Explore Now →- Spring 2026 ESUG Meeting - Social Celebration | 02-Jun-2026
- Spring 2026 ESUG Meeting | 03-Jun-2026
- Ask the Expert: Fast, Clear, Beautiful: Your First Steps With PROC SGPLOT | 04-Jun-2026
- Ask the Expert: R and SAS Working Seamlessly Together: Unlocking PROC R in Viya for Life Sciences | 11-Jun-2026
- Ask the Expert: Can Agents Reduce Planning Friction in CPG Supply Chains? | 16-Jun-2026
- Ask the Expert: Get Meaningful Results With New Features in SAS Customer Intelligence 360 | 25-Jun-2026
-
3 replies
-
07-23-2012 02:56 PM
-
3982 views
-
1 like
-
2 in conversation
-
