- Home
- /
- Analytics
- /
- Forecasting
- /
- Forecast Studio - Seasonal Unit Root Test
- RSS Feed
- Mark Topic as New
- Mark Topic as Read
- Float this Topic for Current User
- Bookmark
- Subscribe
- Mute
- Printer Friendly Page

- Mark as New
- Bookmark
- Subscribe
- Mute
- RSS Feed
- Permalink
- Report Inappropriate Content
Hello,
I work on Forecast Studio with a single series. In the Series View window i see from the seasonal unit root test (plot and table) that the series is characterized by seasonality (fail to reject the null hypothesis of seasonality existence). When i ask for a seasonal difference through the transformations panel of the same window (series view), the probabilities in the seasonal unit root test table and the seasonal unit root test plot do not change; they still show the seasonal unit root test results of the original series (before being seasonally differenced). Though the plot of the actual time series is updated and shows the differenced series. Is there a way to see the seasonal unit root test results after i have differenced the series?
Thanks in advance,
Andreas
Accepted Solutions

- Mark as New
- Bookmark
- Subscribe
- Mute
- RSS Feed
- Permalink
- Report Inappropriate Content
Hello Andreas -
This seems to be a defect indeed.
Can you please go ahead and contact Technical Support?
Thanks,
Udo
- Mark as New
- Bookmark
- Subscribe
- Mute
- RSS Feed
- Permalink
- Report Inappropriate Content
Hello Andreas -
Which version of SAS Forecast Server are you using?
I just tested this with our current development version and could not replicate.
It might be worthwhile to open a ticket with Technical Support.
Thanks,
Udo
- Mark as New
- Bookmark
- Subscribe
- Mute
- RSS Feed
- Permalink
- Report Inappropriate Content
Hello Udo,
Thanks for your answer. I am using version 12.1. Before i use technical support facilities i would like to show you what i mean in case i miss something.
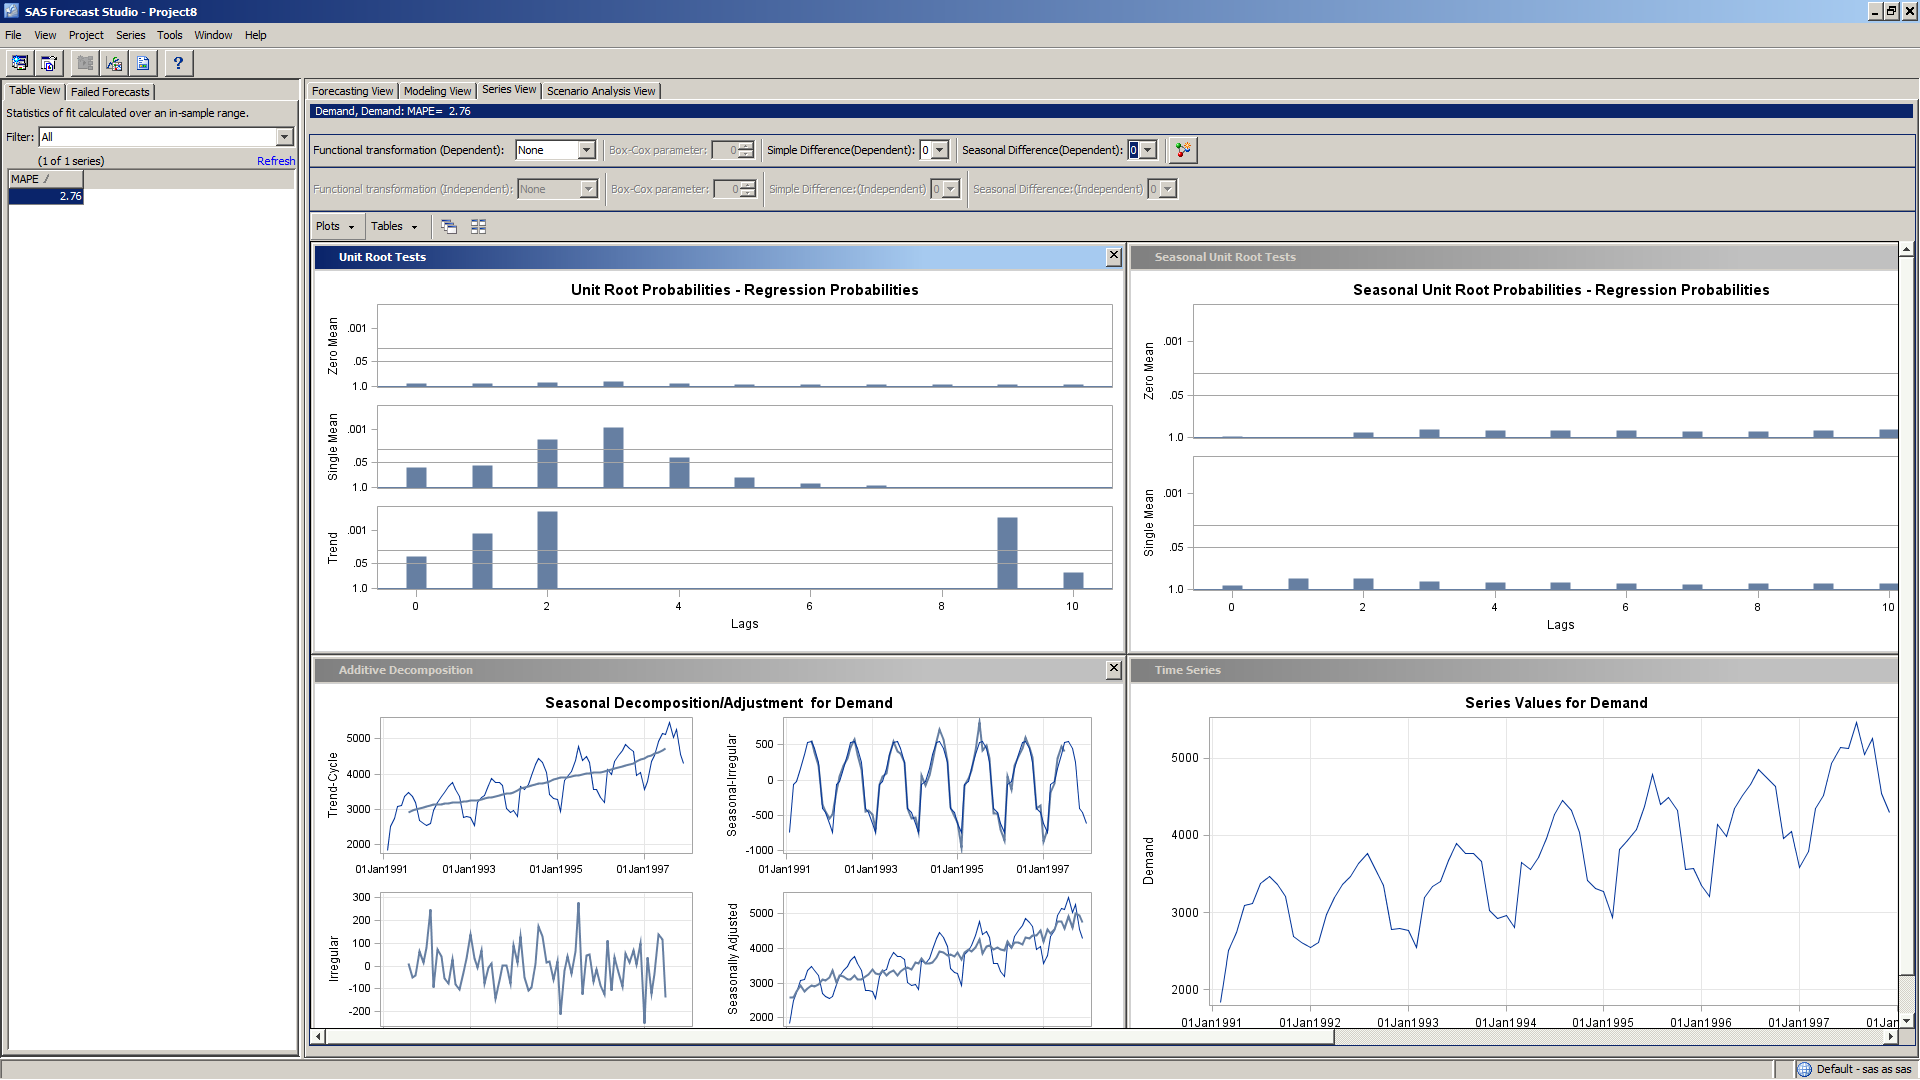
In Image1 below we can see the unit root and seasonal unit root plots along with the graph from the actual series (i guess that these are the Dickey Fuller and Dickey Fuller Hasza tests as it was in TSFS).
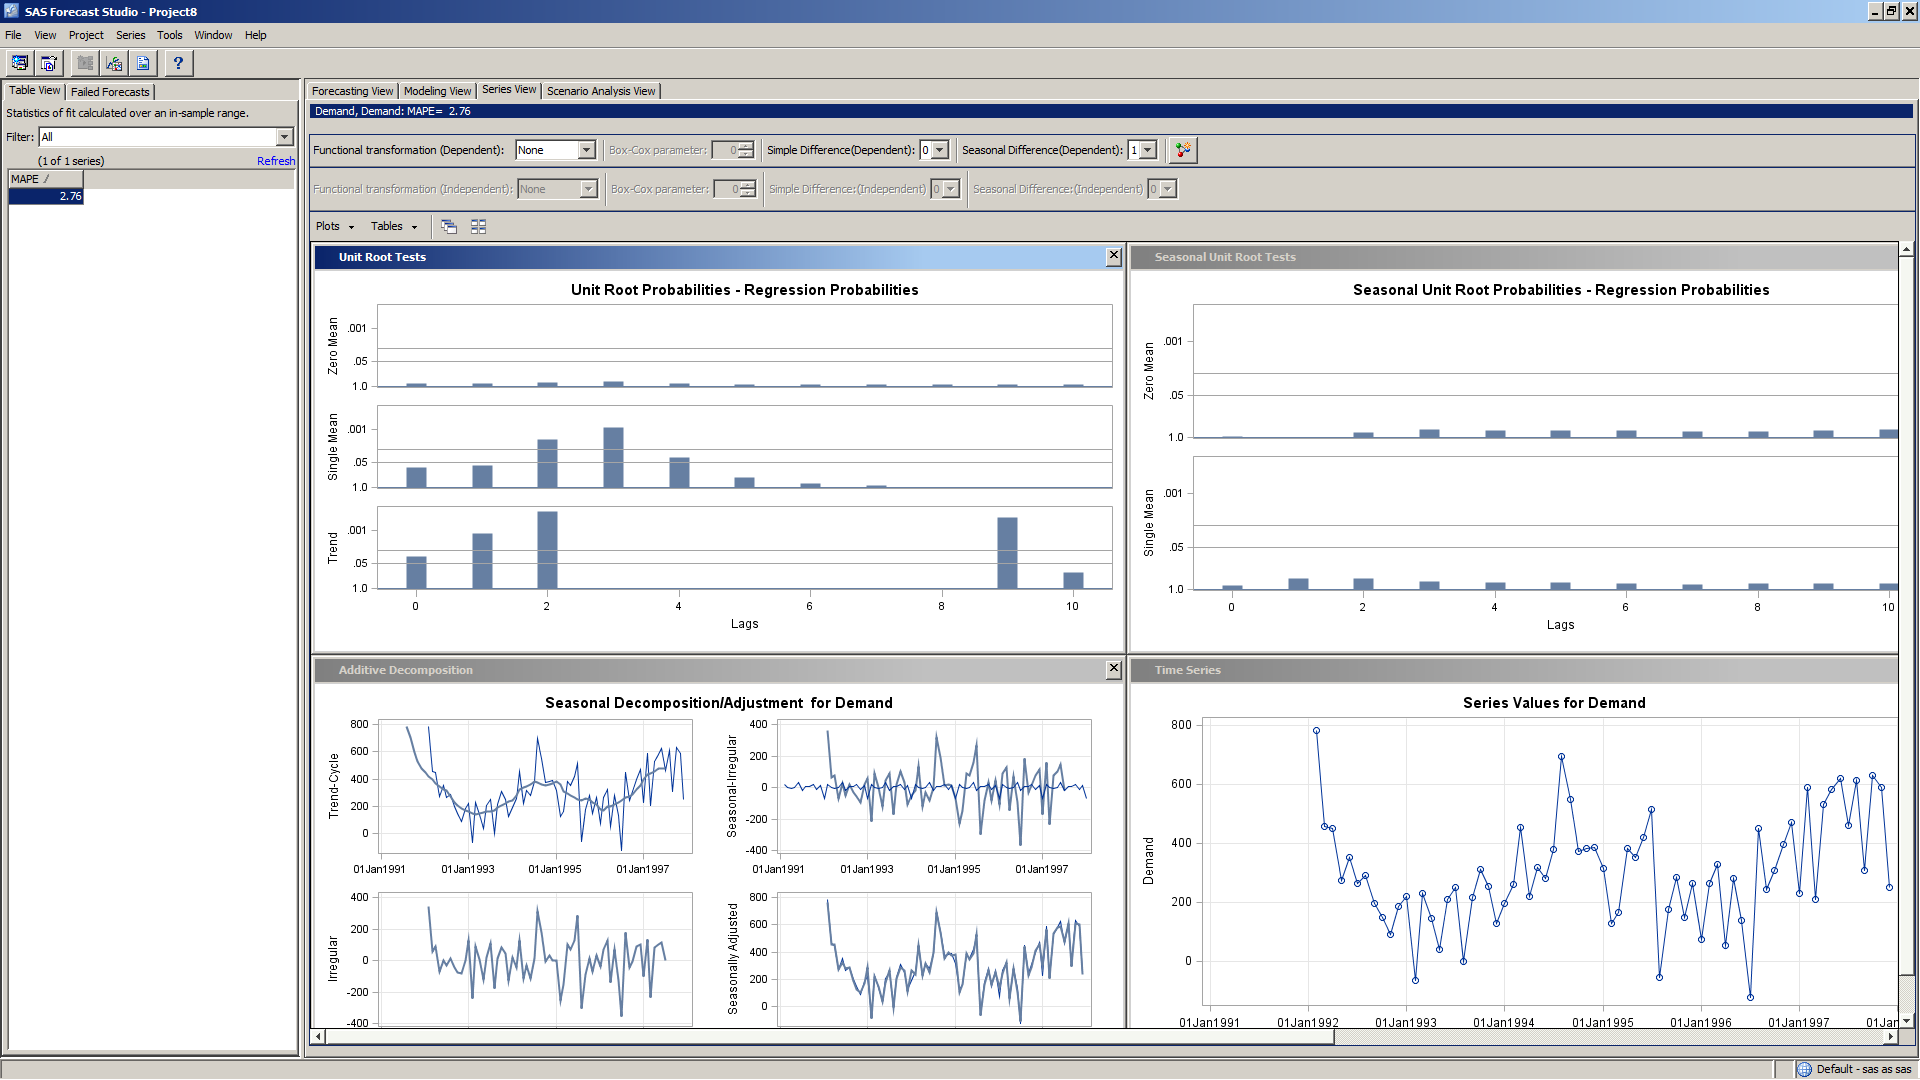
In Image2 we can see the same plots but this time i have selected to seasonal difference the series. As we can see the actual series graph changes but the seasonal unit root plot remains the same. I have tested the same time series in TSFS and when i seasonal difference the series, the seasonal unit root plot, in all lags, rejects the null hypothesis of seasonality.
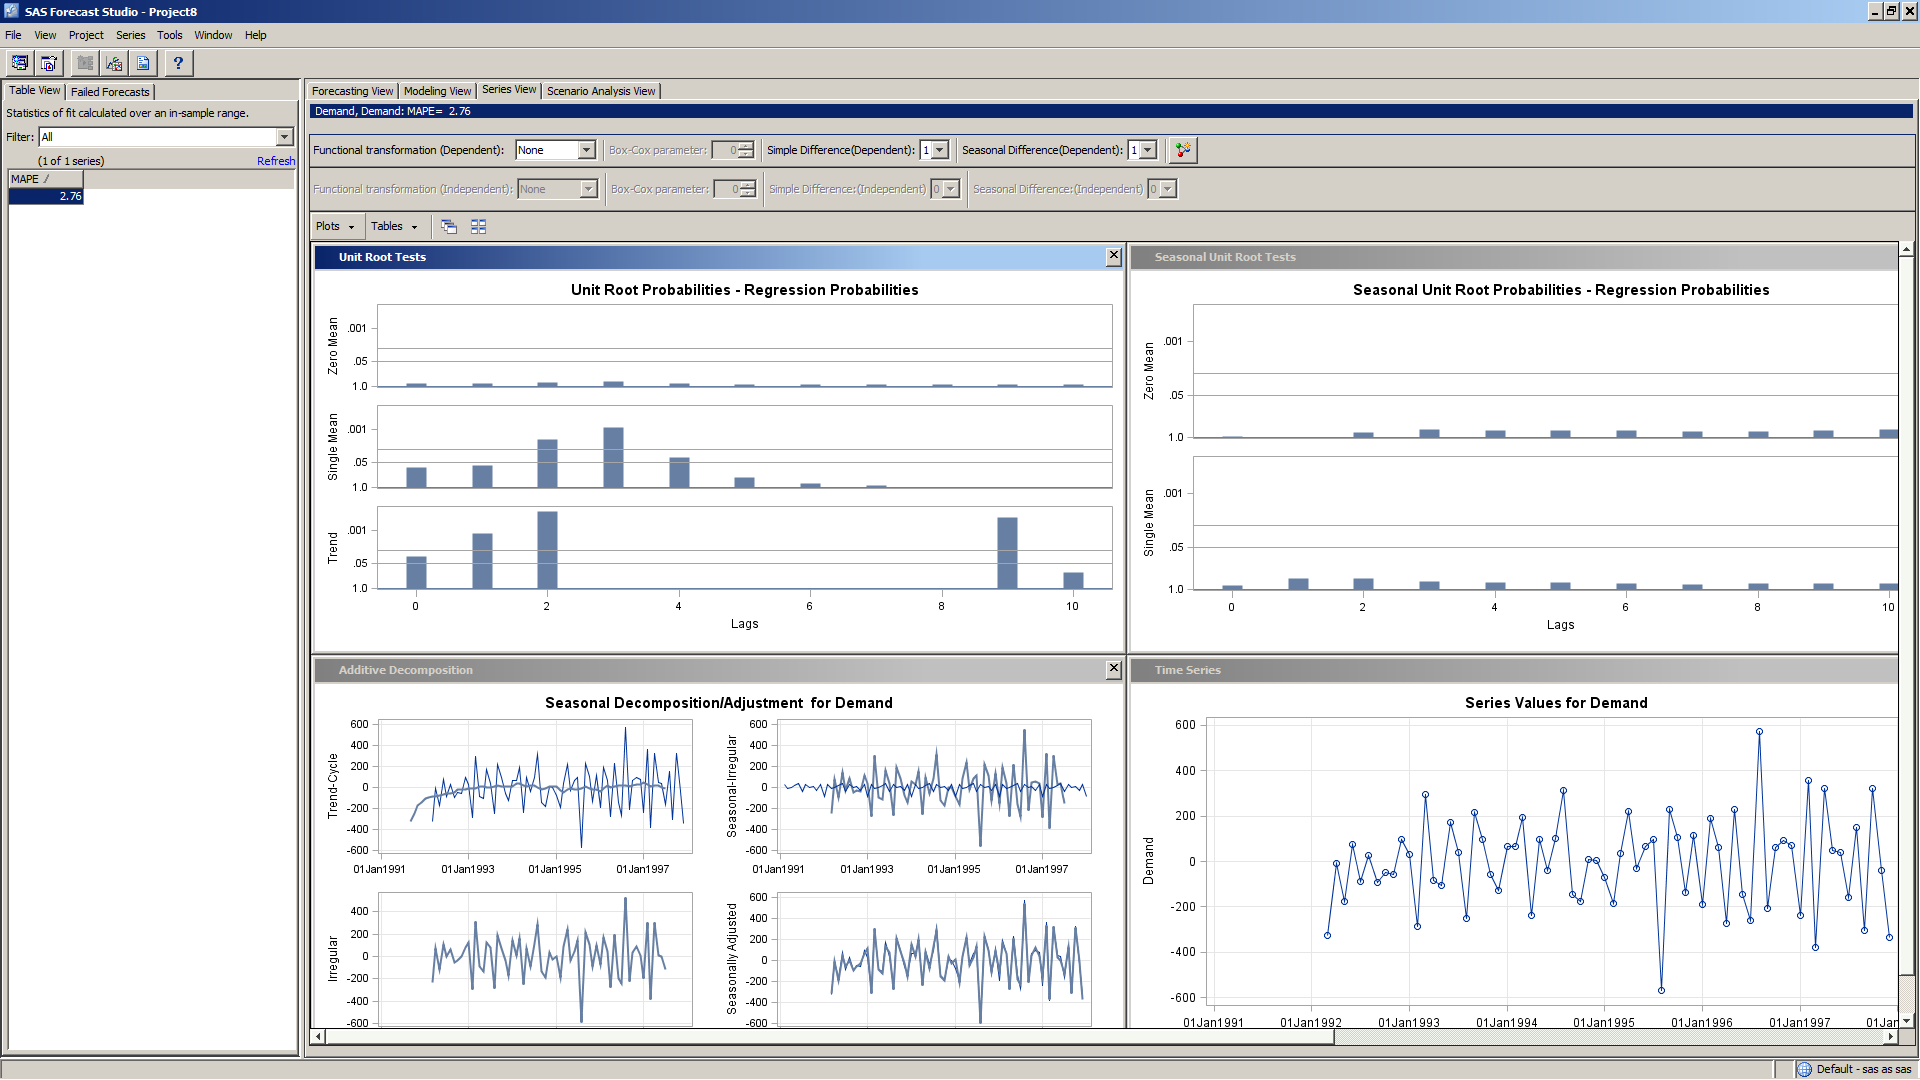
In the third image i have selected to difference and seasonal difference the series but only the actual series graph changes; no changes in the unit root and seasonal unit root plots.
I guess that when i transform the series in terms of differncing and seasonal differencing, changes should take place in the two unit root plots.
I hope i am not missing something obvious!
Thanks in advance,
Andreas
- Mark as New
- Bookmark
- Subscribe
- Mute
- RSS Feed
- Permalink
- Report Inappropriate Content
Hello Andreas -
This seems to be a defect indeed.
Can you please go ahead and contact Technical Support?
Thanks,
Udo
- Mark as New
- Bookmark
- Subscribe
- Mute
- RSS Feed
- Permalink
- Report Inappropriate Content
Thanks Udo,
I will contact technical support.
Andreas
.jpg")
Catch up on SAS Innovate 2026
Nearly 200 sessions are now available on demand in the Innovate Hub.
Watch Now →- Live Webinar: Unlocking Value With Managed Cloud Services | 16-Jun-2026
- Ask the Expert: Can Agents Reduce Planning Friction in CPG Supply Chains? | 16-Jun-2026
- Ask the Expert: Mit KI zur Höchstleistung: SAS Studio Copilot in Aktion! | 25-Jun-2026
- Ask the Expert: Get Meaningful Results With New Features in SAS Customer Intelligence 360 | 25-Jun-2026
- Ask the Expert: Modern, offen, skalierbar: Datenarchitektur mit SAS®Viya | 09-Jul-2026
- MinnSUG 2026 Annual SAS Conference | 22-Jul-2026
-
4 replies
-
02-16-2014 07:18 AM
-
3613 views
-
5 likes
-
2 in conversation
-
