- Home
- /
- Programming
- /
- Enterprise Guide
- /
- Re: Proc genmod error
- RSS Feed
- Mark Topic as New
- Mark Topic as Read
- Float this Topic for Current User
- Bookmark
- Subscribe
- Mute
- Printer Friendly Page

- Mark as New
- Bookmark
- Subscribe
- Mute
- RSS Feed
- Permalink
- Report Inappropriate Content
Hello,
I want to run a logistic regression on data which are propensity score matched and hence correlated. My dependent variable is the number of healthcare visits in ADHD patients and the independent variables include age, sex, ethnicity, physician specialty, confirmed diagnosis of ADHD in pre-index period, number and psych and non-psych related hospitalizations, ED visits, office visits and other visits, and number of concomitant medications. I controlled for the propensity score as well. All the covariates that were controlled for in this model were also used while estimating the propensity score. The control patients are ones initiated on extended release methylphenidate and the cases are those on immediate release methylphenidate. I used the following code:
proc genmod data=psm.matched51_1 descending;
class case matchto male ethnicity2 speccode2 preconfirm;
model c_othvst=prob case ageatindex male ethnicity2 npcomorbids psychcomorbs psychvst1 npsyvst1 poffvst1 pervst1
noffvst1 nervst1 speccode2 conpstonly preconfirm nothvst1 pothvst1/ dist=binomial link=logit type3;
repeated subject=matchto/type=cs corrw covb;
estimate "Case" case -1 1 / exp;
run;
I am getting the following error:
ERROR: Error in computing the variance function.
ERROR: Error in parameter estimate covariance computation.
ERROR: Error in estimation routine.
Please could someone help me out with what this error means and what can be done to overcome the error. I am new to proc genmod and am having an issue with this. I am using SAS 9.3.
Thank you very much.
Pooja Desai
The University of Texas at Austin

- Mark as New
- Bookmark
- Subscribe
- Mute
- RSS Feed
- Permalink
- Report Inappropriate Content
Since your response variable is a count, the binomial distribution is not appropriate. Check to see if the sample mean is roughly equal to the sample variance for the cells in your cross-tabulation. If they are approximately equal, change to a Poisson distribution. If there is evidence of over or underdispersion (variances are much larger or much smaller than the means), try a negative binomial distribution. The line should be a log link in both cases.
Good luck, and let us know if this helps.
Steve Denham
- Mark as New
- Bookmark
- Subscribe
- Mute
- RSS Feed
- Permalink
- Report Inappropriate Content
THank you Steve.
If I change the response variable to whether or not the patient had a healthcare visit (coded as 1=yes and 0=no) with everything else in the model unchanged, it gives me the same error. I need odds ratios and so I need tot do a logistic regression procedure.
PLease could you tell me what could be the problem ion that case.
THank you very much.
Pooja
- Mark as New
- Bookmark
- Subscribe
- Mute
- RSS Feed
- Permalink
- Report Inappropriate Content
Here is where I ask a bunch of questions, some of which will ultimately have nothing to do with what is going on.
1. What does the cross-tabulation for this endpoint reveal? Are there a lot of empty cells? Are the cells with sparse counts also typified by extreme values of the continuous covariates?
2. Do you have enough data? Using the rule of thumb of 10 'yes' responses needed for each parameter estimated, you will need at least 180 yes responses (and maybe more depending on how many levels are in each of the categorical covariates).
3. The request for odds ratios can be dealt with once we figure out how to get the model to stop throwing errors. Exponentiating estimates is the usual approach.
4. I assume that the error messages appear with nothing in the output, meaning that the algorithm never gets started. If this is incorrect, what does appear in the output?
5. Were you possibly considering the number of visits as an ordinal response? Then the distribution should be multinomial, with a cumulative logit link. Unfortunately, I think the errors that are currently occurring will still occur under these options, so perhaps some others can help out on this.
Steve Denham
- Mark as New
- Bookmark
- Subscribe
- Mute
- RSS Feed
- Permalink
- Report Inappropriate Content
Thank you very much Suresh and Steve for your responses.
@Suresh: You are right, the variables not listed in the class statement are not categorical ones. When I put only my IV of interest and the propensity score it rus fine. However, once I started adding the covariates, it gives the error.
@Steve: I have 1930 observations. 1028 are yes and 902 are no. The data is cleaned and hence no missing values. The exact message I am getting is
NOTE: Class levels for some variables were not printed due to excessive size.
NOTE: PROC GENMOD is modeling the probability that c_othvst='1'.
NOTE: Algorithm converged.
ERROR: Error in computing the variance function.
ERROR: Error in parameter estimate covariance computation.
ERROR: Error in estimation routine.
NOTE: The SAS System stopped processing this step because of errors.
NOTE: PROCEDURE GENMOD used (Total process time):
real time 0.47 seconds
cpu time 0.23 seconds
The output has point estimates but no variances or test results.The CIs are 0.00 to 0.00.
The model runs when I say type=ind which, if I understand correctly, means that the repeated measure are not correlated. However, that isn't the case here since they are propensity score matched subjects.
Is there any way to rectify the error?
I really appreciate all your help on this.
Thanks!
Pooja
- Mark as New
- Bookmark
- Subscribe
- Mute
- RSS Feed
- Permalink
- Report Inappropriate Content
Scary thing number one: NOTE: Class levels for some variables were not printed due to excessive size. I hope this refers to the matchto variable, because if it is the other model variables, we are in trouble.
If type=cs doesn't work and type=ind does, then I fear that the working correlation matrix is not positive definite. Since it should only be a 2x2 matrix, this is alarming, but it may be because the variables used in the propensity scoring are also included in the model. If there is very good matching, once their effect is removed, the residual correlation between subjects goes nearly to zero. What happens when you fit the model, excluding the effects used in the propensity scoring?
If that works, then it is a case of how do we get these interesting effects into the model, or should they even be included? Right now, I am thinking of using PROC GLIMMIX, and specifying type=CHOL to avoid the positive definite problem (plus I am a lot more familiar with tuning things when GLIMMIX has problems). If excluding the propensity variables does not work, then we are dealing with a whole other set of problems.
Steve Denham
Steve Denham
- Mark as New
- Bookmark
- Subscribe
- Mute
- RSS Feed
- Permalink
- Report Inappropriate Content
Hi Steve,
The note does refer to the matchto variable. When I exclude the variables used in the propensity scoring and only keep the propensity score and the variable stating whether the subject is a case or control, the model runs fine. However, based on paired same t-tests and Mc Nemars tests that I conducted on the IVs after matching, few variables were significant. So I wanted to include the covariates in the model.
I tried running proc glimmix using the following code but it did not run at all. Gave no errors but did not run. I waited as long as 20 minutes but nothing.
proc glimmix data=psm.matched51_1;
class case matchto male ethnicity2 speccode2 preconfirm;
model c_othvst=prob case ageatindex male ethnicity2 npcomorbids psychcomorbs psychvst1 npsyvst1 poffvst1 pervst1
noffvst1 nervst1
speccode2 conpstonly preconfirm nothvst1 pothvst1/ dist=binomial link=logit solution;
random matchto/ type=chol;
estimate "Case" case -1 1 / exp;
run;
I am guessing something is terribly wrong with this code?
Thank you very much for your help. I really appreciate it.
Pooja
- Mark as New
- Bookmark
- Subscribe
- Mute
- RSS Feed
- Permalink
- Report Inappropriate Content
Sort the dataset by subject (matchto) and try this:
proc glimmix data=psm.matched51_1;
class case matchto male ethnicity2 speccode2 preconfirm;
model c_othvst=prob case ageatindex male ethnicity2 npcomorbids psychcomorbs psychvst1 npsyvst1 poffvst1 pervst1
noffvst1 nervst1 speccode2 conpstonly preconfirm nothvst1 pothvst1/ dist=binary link=logit solution;
random intercept/subject=matchto type=chol;
estimate "Case" case -1 1 / exp;
run;
If your dataset is even moderately sized, this may take a long time to run. I bolded a couple of changes that might help, but I would not be surprised if this took several hours, and you got the message that it had not converged. I want to get a feel for what the likelihood function is doing.
You might start by running without the propensity variables to see if it gives a result similar to GENMOD without those in the model, and then adding in variables until there are convergence problems.
Steve Denham
- Mark as New
- Bookmark
- Subscribe
- Mute
- RSS Feed
- Permalink
- Report Inappropriate Content
Hello Steve,
Thank you very much for the code and your recommendation. When I ran both genmod and glimmix without the propensity variables they gave similar (not exactly same) results. I then added in one variable at a time and the convergence problem only arises when I add the variable nothvst1. It is a continuous variable ranging between 0 and 146. The problem with this variable occurs in both genmod and glimmix.
However, paired sample ttests on the matched sample shows that even after matching this variable differs significantly which is why I had added it to the logistic regression code as a controlling variable.
Is there a way to overcome this issue?
Thanks,
Pooja
- Mark as New
- Bookmark
- Subscribe
- Mute
- RSS Feed
- Permalink
- Report Inappropriate Content
Hi Pooja,
I just came across an interesting discussion on propensity scores on the MedStats Google group. It started out asking about calculation of sample size, but has morphed into a discussion of analysis methods, and I think two of the recent posts (by Steve Simon and Mark Schwartz) present an approach that may be useful (using the logit of the propensity score as a covariate).
As far as the current problem, what happens when you plot the other variables against nothvst1 as the X variable? Is there any kind of "unusual" appearance, such as severe clustering? This looks like an excellent place to use a matrix plot to examine what might be causing this problem.
Steve Denham
- Mark as New
- Bookmark
- Subscribe
- Mute
- RSS Feed
- Permalink
- Report Inappropriate Content
Hello Steve,
The discussion is indeed very informative. Thank you for letting me know of the same.
I am inserting an image of the scatter plot of my two variables of interest. It looks very much like the scatter plots using the same DV with other continuous IVs.
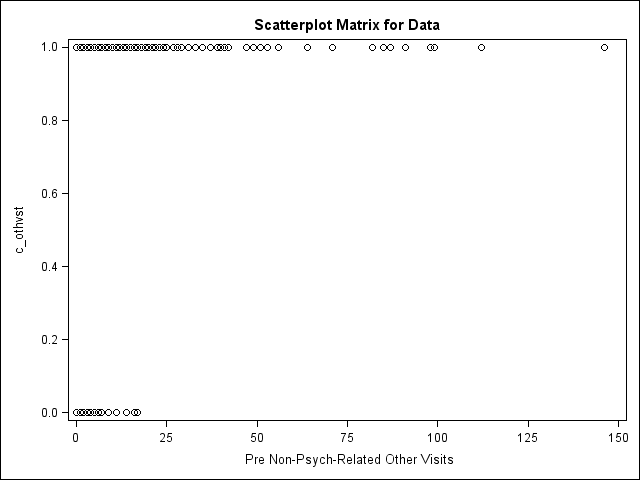
Do you think there is something very unusual?
I really appreciate your help in this process.
Thank you.
Pooja
- Mark as New
- Bookmark
- Subscribe
- Mute
- RSS Feed
- Permalink
- Report Inappropriate Content
Hmm. Well, that particular plot is just about what I expected, and not all that helpful ![]() .
.
What about a plot of nothvst1 versus the other propensity score variables? What concerns me is the possiblity of some kind of multi-collinearity, that would be the equivalent of quasi-separation, if these were categorical variables.
Steve Denham
- Mark as New
- Bookmark
- Subscribe
- Mute
- RSS Feed
- Permalink
- Report Inappropriate Content
Hello Steve,
The other graphs also look similar to the one I sent you previously.
I had a question for you. This model works fine with type=ind in the repeated statement. I ran the same model (with another DV) with type=ind and type=cs and it gave very similar results. I am not sure what exactly the independent (ind) and exchangeable (cs) imply in the model. I though it was the correlation between the repeated measures but it gives very similar answers in either case. If I use type=ind is it the same as running the model without the repeated statement?
I also tried running this model in SPSS and it gave me an output. I tried it with both type of correlation matrix set at independent and exchangeable and both worked and gave me the same answer.
I am doing something wrong here?
Thank you. I really appreciate your help!
Pooja
- Mark as New
- Bookmark
- Subscribe
- Mute
- RSS Feed
- Permalink
- Report Inappropriate Content
I don't think there is anything "wrong". I just think that there is collinearity of some sort in the propensity variables. That is why I think putting in the logit of the score may be the way to go.
Steve Denham
- Mark as New
- Bookmark
- Subscribe
- Mute
- RSS Feed
- Permalink
- Report Inappropriate Content
Thank you Steve. I will put the logit of the score in the equation.
Really appreciate all your help.
Pooja
.jpg")
Catch up on SAS Innovate 2026
Nearly 200 sessions are now available on demand in the Innovate Hub.
Watch Now →Check out this tutorial series to learn how to build your own steps in SAS Studio.

Find more tutorials on the SAS Users YouTube channel.
SAS Training: Just a Click Away
Ready to level-up your skills? Choose your own adventure.
-
17 replies
-
11-29-2012 02:14 AM
-
19226 views
-
1 like
-
3 in conversation
-
