- Home
- /
- Programming
- /
- Enterprise Guide
- /
- Problem with legend in scatterplot
- RSS Feed
- Mark Topic as New
- Mark Topic as Read
- Float this Topic for Current User
- Bookmark
- Subscribe
- Mute
- Printer Friendly Page
- Mark as New
- Bookmark
- Subscribe
- Mute
- RSS Feed
- Permalink
- Report Inappropriate Content
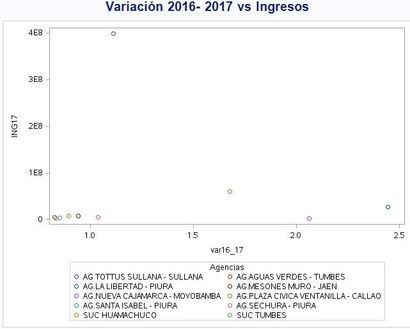
Hi, I'm using EG 7.12 and I have a problem when I use markerattrs. (NBRSUCAGE is the variable with the label names for the graph legend)
Using this code, the legend appears:
proc sgplot data=stats.cuadro;
scatter x=var16_17 y=ING17 /group=NBRSUCAGE  name="ag";
discretelegend "ag" / title="Agencias";
title "Variación 2016- 2017 vs Ingresos";
run;
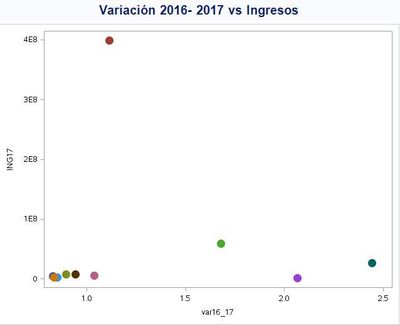
But, when I agree the markeratrrbs option, the legend disappears:
proc sgplot data=stats.cuadro;
scatter x=var16_17 y=ING17 /group=NBRSUCAGE markerattrs=(symbol=circlefilled size=3pct) name="ag";
discretelegend "ag" / title="Agencias";
title "Variación 2016- 2017 vs Ingresos";
run;
How could I maintain the changes without losing the legend?
Also, It would be a plus if there is any way to have different symbols for markers without coding a previous template. Thank you very much!
Accepted Solutions
- Mark as New
- Bookmark
- Subscribe
- Mute
- RSS Feed
- Permalink
- Report Inappropriate Content
1: What are you trying to accomplish with the DISCRETELEGEND Statement?
2: You can use different symbols for markers without coding a previous template by setting the ATTRPRIORITY=NONE in the ODS GRAPHICS Statement and use the STYLEATTRS Statement as in the following small example
ods graphics on / attrpriority=none;
proc sgplot data=sashelp.iris noautolegend;
   styleattrs datasymbols=(circlefilled squarefilled starfilled) ;
   scatter x=sepallength y=sepalwidth / group=species;
   keylegend / location=inside position=NE across=1;
run;
- Mark as New
- Bookmark
- Subscribe
- Mute
- RSS Feed
- Permalink
- Report Inappropriate Content
1. Justo to show the legend next to the graph, I don't want to have label over the markers. Is there a better way?.
2. Ok, It's needed a previous template. Thanks!
- Mark as New
- Bookmark
- Subscribe
- Mute
- RSS Feed
- Permalink
- Report Inappropriate Content
Use the KEYLEGEND Statement and alter the POSITION= and LOCATION= Options to put the legend where you want it
- Mark as New
- Bookmark
- Subscribe
- Mute
- RSS Feed
- Permalink
- Report Inappropriate Content
Hi draycut, I checked the keylegend statement, got better output, but I have the same problem when I included the markerattrs option. After many changes, I realize that the problem appears when you use pct as measure for the size marker, I changed it to mm and the legend appears. Thanks!!!
Check out this tutorial series to learn how to build your own steps in SAS Studio.
Find more tutorials on the SAS Users YouTube channel.
SAS Training: Just a Click Away
Ready to level-up your skills? Choose your own adventure.


