- Home
- /
- Programming
- /
- Enterprise Guide
- /
- Multiple Line Plot graph - Vertical Axis must be Numeric
- RSS Feed
- Mark Topic as New
- Mark Topic as Read
- Float this Topic for Current User
- Bookmark
- Subscribe
- Mute
- Printer Friendly Page
- Mark as New
- Bookmark
- Subscribe
- Mute
- RSS Feed
- Permalink
- Report Inappropriate Content
Hi Forum,
I've got some data that I'm trying to create a Multiple Line graph for.
I have Mon_Yr, Sales_Amount & Products, so I want to show all the 5 Products Monthly Sales totals for a year
So, using the Multiple Line Plot Wizard in SAS EG 4.3, I put the Mon_Yr in the Horizontal Axis, & I can't get the graph to complete as I'm not sure what to use for the Vertical Axis?
Putting the Sales in the Vertical doesn't make a sensible graph.
I thought of creating a Range of sales banding s $0-$2000, $2001-$4000 etc etc but I can't enter this into the Vertical axis as it will only accept a Numeric data type.
Does anyone have a step by step guide/video to create a Multiple line graph? It shouldn't be this hard...
Thanks
- Mark as New
- Bookmark
- Subscribe
- Mute
- RSS Feed
- Permalink
- Report Inappropriate Content
I would assume it would be sales on the vertical axis and then the 5 different products form the lines. I'm assuming you have 5 products with monthly data for a year.
If otherwise, please clarify what your data looks like and what your graph should look like.
- Mark as New
- Bookmark
- Subscribe
- Mute
- RSS Feed
- Permalink
- Report Inappropriate Content
That's correct Reeza,
Months along the bottom & The Sales on the Vertical & the Product numbers make the lines.
I need to know what to put in the Vertical, Group (Limit 1 field) & then Group Charts By.
Thanks
- Mark as New
- Bookmark
- Subscribe
- Mute
- RSS Feed
- Permalink
- Report Inappropriate Content
What does your data look like? Do you have 5 diff sales variables or 1 variable with sales with a group differentiating products?
- Mark as New
- Bookmark
- Subscribe
- Mute
- RSS Feed
- Permalink
- Report Inappropriate Content
 Hi Reeza,
To explain further, I have 5 products, each product has a sales amount per month for one year.
I want to see five lines at various levels depending on their value against the vertical axis with the Mth_Yr on the horizontal axis.
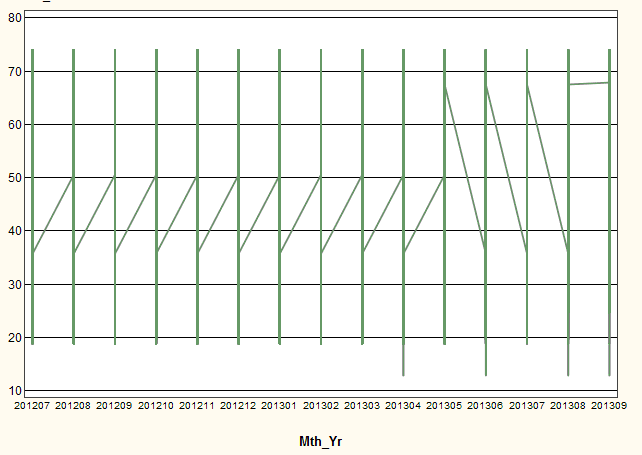
I've used the wizard with only one Product & got this confusing looking graph with vertical lines instead of the one wavy line I was expecting.
Can you or anyone advise why this is happening? see attched image.
Thanks
- Mark as New
- Bookmark
- Subscribe
- Mute
- RSS Feed
- Permalink
- Report Inappropriate Content
I think it has to do with your data. Can you post an example of your data?
As close to real as possible in terms of structure and number of records
Check out this tutorial series to learn how to build your own steps in SAS Studio.
Find more tutorials on the SAS Users YouTube channel.
SAS Training: Just a Click Away
Ready to level-up your skills? Choose your own adventure.


