- Home
- /
- Programming
- /
- Enterprise Guide
- /
- Fitting distributions directly from a frequency table
- RSS Feed
- Mark Topic as New
- Mark Topic as Read
- Float this Topic for Current User
- Bookmark
- Subscribe
- Mute
- Printer Friendly Page

- Mark as New
- Bookmark
- Subscribe
- Mute
- RSS Feed
- Permalink
- Report Inappropriate Content
Hi there,
I was wondering if there is a way to fit a distribution directly from a frequency table without having the raw data. I've tried using proc univaraite but you can't use the weight
option with the histrogram option. I'm a bit stuck.
Thank you
Accepted Solutions

- Mark as New
- Bookmark
- Subscribe
- Mute
- RSS Feed
- Permalink
- Report Inappropriate Content
I think you would use FREQ statement.
label Gap = 'Plate Gap in cm';
input Gap @@;
datalines;
0.746 0.357 0.376 0.327 0.485 1.741 0.241 0.777 0.768 0.409
0.252 0.512 0.534 1.656 0.742 0.378 0.714 1.121 0.597 0.231
0.541 0.805 0.682 0.418 0.506 0.501 0.247 0.922 0.880 0.344
0.519 1.302 0.275 0.601 0.388 0.450 0.845 0.319 0.486 0.529
1.547 0.690 0.676 0.314 0.736 0.643 0.483 0.352 0.636 1.080
;
proc freq data=plates noprint;
tables gap / out=PlatesFreq;
run;
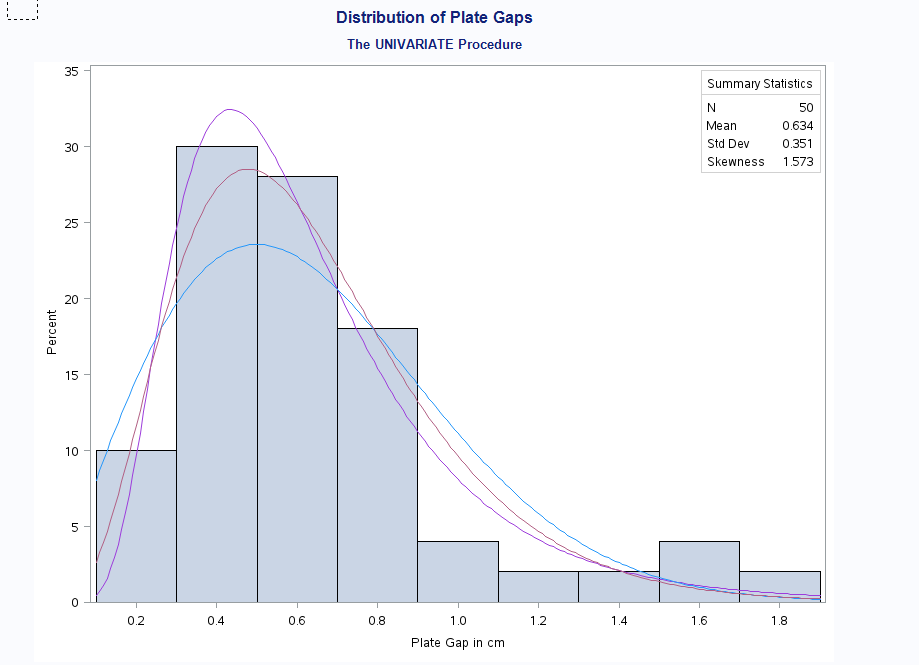
title 'Distribution of Plate Gaps';
ods graphics off;
ods select ParameterEstimates GoodnessOfFit FitQuantiles MyHist;
proc univariate data=PlatesFreq;
var Gap;
freq count;
histogram / midpoints=0.2 to 1.8 by 0.2
lognormal
weibull
gamma
vaxis = axis1
name = 'MyHist';
inset n mean(5.3) std='Std Dev'(5.3) skewness(5.3)
/ pos = ne header = 'Summary Statistics';
axis1 label=(a=90 r=0);
run;
- Mark as New
- Bookmark
- Subscribe
- Mute
- RSS Feed
- Permalink
- Report Inappropriate Content
I think you would use FREQ statement.
label Gap = 'Plate Gap in cm';
input Gap @@;
datalines;
0.746 0.357 0.376 0.327 0.485 1.741 0.241 0.777 0.768 0.409
0.252 0.512 0.534 1.656 0.742 0.378 0.714 1.121 0.597 0.231
0.541 0.805 0.682 0.418 0.506 0.501 0.247 0.922 0.880 0.344
0.519 1.302 0.275 0.601 0.388 0.450 0.845 0.319 0.486 0.529
1.547 0.690 0.676 0.314 0.736 0.643 0.483 0.352 0.636 1.080
;
proc freq data=plates noprint;
tables gap / out=PlatesFreq;
run;
title 'Distribution of Plate Gaps';
ods graphics off;
ods select ParameterEstimates GoodnessOfFit FitQuantiles MyHist;
proc univariate data=PlatesFreq;
var Gap;
freq count;
histogram / midpoints=0.2 to 1.8 by 0.2
lognormal
weibull
gamma
vaxis = axis1
name = 'MyHist';
inset n mean(5.3) std='Std Dev'(5.3) skewness(5.3)
/ pos = ne header = 'Summary Statistics';
axis1 label=(a=90 r=0);
run;
- Mark as New
- Bookmark
- Subscribe
- Mute
- RSS Feed
- Permalink
- Report Inappropriate Content
Thanks I think that is what I was looking for!
Now just a smaller problem I hope you would be able to help me with (it looks like you know your stuff ![]() ):
):
Lets say I already have binned my data according to a certain format (unequal bins). Is there a way to suppress proc univariate from creating automatic bins for the data and fit the distribution according to my binning format?
- Mark as New
- Bookmark
- Subscribe
- Mute
- RSS Feed
- Permalink
- Report Inappropriate Content
Not sure but perhaps one of the MIDPOINT related options is what you need. Perhaps show an example of your data and univariate code.
- Mark as New
- Bookmark
- Subscribe
- Mute
- RSS Feed
- Permalink
- Report Inappropriate Content
The data is formatted and binned according to this:
LOW <- 0 = 'X0'
0.00000 <- 0.00001 = 'X1'
0.00001 <- 0.00002 = 'X2'
0.00002 <- 0.00005 = 'X3'
0.00005 <- 0.00007 = 'X4'
0.00007 <- 0.00010 = 'X5'
0.00010 <- 0.00012 = 'X6'
0.00012 <- 0.00017 = 'X7'
0.00017 <- 0.00025 = 'X8'
0.00025 <- 0.00035 = 'X9'
0.00035 <- 0.00047 = 'X10'
0.00047 <- 0.00062 = 'X11'
0.00062 <- 0.00080 = 'X12'
.
.
.
0.50000 <- 0.65000 = 'X97'
0.65000 <- 0.80000 = 'X98'
0.80000 <- 1.00000 = 'X99'
1.00000 <- HIGH = 'X101'
This formatting is applied and to spread out the data a little bit, otherwise everyhing is thrown into the first two or three bins. So I have my bins and I have a frequency in each and now I want to fit a distribution to the data.
.jpg")
Catch up on SAS Innovate 2026
Nearly 200 sessions are now available on demand with the SAS Innovate Digital Pass.
Explore Now →Check out this tutorial series to learn how to build your own steps in SAS Studio.

Find more tutorials on the SAS Users YouTube channel.
SAS Training: Just a Click Away
Ready to level-up your skills? Choose your own adventure.
-
4 replies
-
11-04-2014 04:40 AM
-
3274 views
-
0 likes
-
2 in conversation
-
