- Home
- /
- Programming
- /
- Enterprise Guide
- /
- Re: Fillin in data after Transpose
- RSS Feed
- Mark Topic as New
- Mark Topic as Read
- Float this Topic for Current User
- Bookmark
- Subscribe
- Mute
- Printer Friendly Page

- Mark as New
- Bookmark
- Subscribe
- Mute
- RSS Feed
- Permalink
- Report Inappropriate Content
HI All,
I am trying to do some Regression analysis and the table that I am using as my input has some data gaps.
Thesis what I mean by it. I used "Spit Column" function in the EG in order to create a Cross tab Table from a flat table. However as is the case in some cases there is some missing data here and there.
So my question is how do I make empty points (.) become 0 so that I can do my regression analysis.
For general reference I have showed how data looks after transposing the input table.
| Company | Product 1 | Product 2 | Product 3 | Product 4 |
|---|---|---|---|---|
| 1 | $5 | . | $200 | $70 |
| 2 | . | . | $23 | . |
| 3 | $40 | $70 | . | $100 |
| 4 | $23 | . | $44 | $1 |
P.S. There are about 70 Products so i tough about writing a new query and doing computations on each of the new columns but that just seems crazy.
Thanks for any help you can offer.

- Mark as New
- Bookmark
- Subscribe
- Mute
- RSS Feed
- Permalink
- Report Inappropriate Content
What kind of analysis were you planning?
It may be that your data structure would work better as: Company ProductDescription Value. Then you wouldn't have any "gaps".
- Mark as New
- Bookmark
- Subscribe
- Mute
- RSS Feed
- Permalink
- Report Inappropriate Content
well I need to see what Products have the highest impact on Product1.

- Mark as New
- Bookmark
- Subscribe
- Mute
- RSS Feed
- Permalink
- Report Inappropriate Content
Give this a try:
proc stdize data=have out=want reponly MISSING=0;
var Product1-Product4;
run;
Tom
- Mark as New
- Bookmark
- Subscribe
- Mute
- RSS Feed
- Permalink
- Report Inappropriate Content
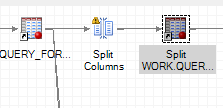
Hi TomKari, the image bellow is the process I have in my EG Project. Where would you recommend i place your code?
- Mark as New
- Bookmark
- Subscribe
- Mute
- RSS Feed
- Permalink
- Report Inappropriate Content
Put it in as a code node (File | New | Program), link the output dataset from your "Split Columns" to it, and replace the dataset name "have" with the name of the dataset created by your split columns.
Tom
.jpg")
Catch up on SAS Innovate 2026
Nearly 200 sessions are now available on demand in the Innovate Hub.
Watch Now →Check out this tutorial series to learn how to build your own steps in SAS Studio.

Find more tutorials on the SAS Users YouTube channel.
SAS Training: Just a Click Away
Ready to level-up your skills? Choose your own adventure.
-
5 replies
-
10-07-2014 03:28 PM
-
3654 views
-
6 likes
-
3 in conversation
-
