- Home
- /
- Programming
- /
- Enterprise Guide
- /
- Re: Erro in axis statement in SAS EG 43?
- RSS Feed
- Mark Topic as New
- Mark Topic as Read
- Float this Topic for Current User
- Bookmark
- Subscribe
- Mute
- Printer Friendly Page

- Mark as New
- Bookmark
- Subscribe
- Mute
- RSS Feed
- Permalink
- Report Inappropriate Content
Hi there, recetly I tried to plot data from electrochemical experiments where the y-axis was haveing datavalues in currents with the units amperes. However as the values themselves were nA the representation was as 1.0e-9 and the like. I tried to scale the y-axis using an axis statement such as:
axis2 order=-1E-8 to 1E-8 by 0.2E-8
but much to surprise this produces an error in the output.
A test program to show it in EG43 is attached together with a jpg from the screen showing the faulty graph when using the axis statement.
Regards
Poul


- Mark as New
- Bookmark
- Subscribe
- Mute
- RSS Feed
- Permalink
- Report Inappropriate Content
your example code shows:
axis2 order=-1E-8 to 1E-8 by 1E-8; The by step works as stated generating 3 ticks, 2 at extremes and on at 0.
axis2 order=-1E-8 to 1E-8 by 0.2E-8; Is incorrect as it uses malformed scientific notation.
try 2E-9 for the step.
- Mark as New
- Bookmark
- Subscribe
- Mute
- RSS Feed
- Permalink
- Report Inappropriate Content
Thanks for adresser this. I am sorry for the confusion between text and pciture. However the use of
axis2 order=-1E-8 to 1E-8 by 2E-9;
DOES produce a faulty graph in EG43. See attached program and snapshot below:
Regards Poul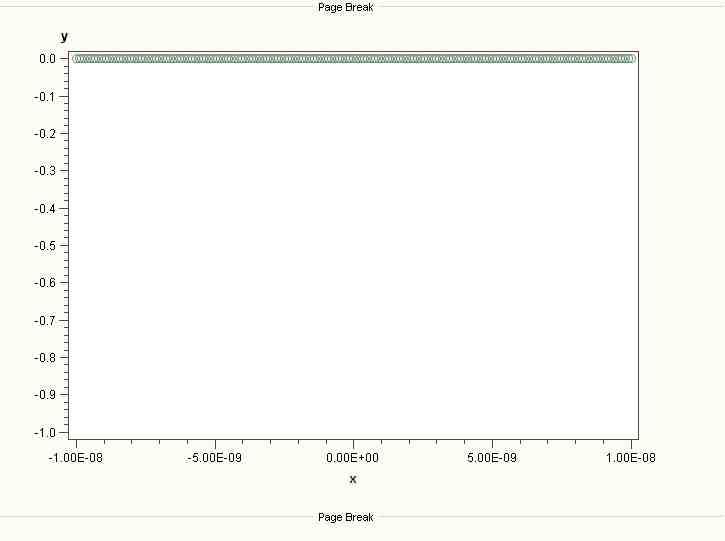
.jpg")
Catch up on SAS Innovate 2026
Nearly 200 sessions are now available on demand with the SAS Innovate Digital Pass.
Explore Now →Check out this tutorial series to learn how to build your own steps in SAS Studio.

Find more tutorials on the SAS Users YouTube channel.
SAS Training: Just a Click Away
Ready to level-up your skills? Choose your own adventure.
-
2 replies
-
09-26-2012 07:37 AM
-
1716 views
-
0 likes
-
2 in conversation
-
