Turn on suggestions
Auto-suggest helps you quickly narrow down your search results by suggesting possible matches as you type.
Showing results for
- Home
- /
- Analytics
- /
- SAS Data Science
- /
- Series plot with month data
Options
- RSS Feed
- Mark Topic as New
- Mark Topic as Read
- Float this Topic for Current User
- Bookmark
- Subscribe
- Mute
- Printer Friendly Page

Lapis Lazuli | Level 10
- Mark as New
- Bookmark
- Subscribe
- Mute
- RSS Feed
- Permalink
- Report Inappropriate Content
Posted 06-24-2015 09:23 AM
(1978 views)
Hi All,
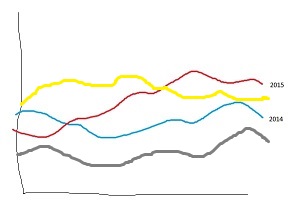
I am trying to draw series plot with of 2 months data only. I have Feb and Mar data of both 2014 and 2015. What would be the code for the series plot
Thanks,
| Date | Outcome |
| 01-Mar-2014 | Loss |
| 27-Feb-2015 | Profit |
| 27-Feb-2014 | Loss |
| 24-Feb-2014 | Profit |
| 01-Mar-2015 | Loss |
| 26-Feb-2015 | Loss |
| 01-Mar-2015 | Loss |
| 01-Mar-2015 | Loss |
| 01-Mar-2015 | Loss |
| 01-Mar-2015 | Profit |
| 01-Mar-2014 | Profit |
| 01-Mar-2014 | Profit |
| 01-Mar-2014 | Profit |
| 25-Feb-2014 | Profit |
Output should look like this:s plot
2 REPLIES 2

Barite | Level 11
- Mark as New
- Bookmark
- Subscribe
- Mute
- RSS Feed
- Permalink
- Report Inappropriate Content

Opal | Level 21
- Mark as New
- Bookmark
- Subscribe
- Mute
- RSS Feed
- Permalink
- Report Inappropriate Content
What is the Y axis on that plot?
PG
.jpg")
Catch up on SAS Innovate 2026
Nearly 200 sessions are now available on demand in the Innovate Hub.
Watch Now →How to choose a machine learning algorithm
Use this tutorial as a handy guide to weigh the pros and cons of these commonly used machine learning algorithms.

Find more tutorials on the SAS Users YouTube channel.
Discussion stats
-
2 replies
-
06-24-2015 09:23 AM
-
1979 views
-
0 likes
-
3 in conversation
-
