- Home
- /
- Analytics
- /
- SAS Data Science
- /
- Re: How to make a plot of the model residuals?
- RSS Feed
- Mark Topic as New
- Mark Topic as Read
- Float this Topic for Current User
- Bookmark
- Subscribe
- Mute
- Printer Friendly Page

- Mark as New
- Bookmark
- Subscribe
- Mute
- RSS Feed
- Permalink
- Report Inappropriate Content
Hello everyone
I need to make a graph of the residuals of a model in SAS Miner. Is this possible?
Thanks!
Accepted Solutions

- Mark as New
- Bookmark
- Subscribe
- Mute
- RSS Feed
- Permalink
- Report Inappropriate Content
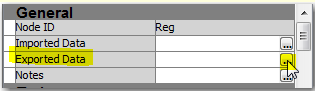
Most of the plots and tables displayed in the Enterprise Miner node results are based on a summary of the data, not the full training data since it can be large. But one way to get a residual plot is as follows:
1) With your modeling node selected, click on the ellipsis for Exported Data from the properties panel:
2) Select the TRAIN data, then click the Explore... button
3) Select Actions>Plot
4) Select Scatter to create a scatter plot of residuals
5) Click on R_target (where target represents your target name) and set Y for the Role
6) Select the predicted values, P_target, or an input variable, or any other variable, and set X for the Role
7) Click on Finish to create your scatter plot

- Mark as New
- Bookmark
- Subscribe
- Mute
- RSS Feed
- Permalink
- Report Inappropriate Content
Hello -
You may want to post your question here: https://communities.sas.com/community/support-communities/sas_data_mining_and_text_mining
Thanks,
Udo

- Mark as New
- Bookmark
- Subscribe
- Mute
- RSS Feed
- Permalink
- Report Inappropriate Content
Hi, I'm a community manager for SAS. Based on udo@sas's comment, I've moved this thread to the data mining community. Thanks for using our communities.
Thanks,
Shelley
- Mark as New
- Bookmark
- Subscribe
- Mute
- RSS Feed
- Permalink
- Report Inappropriate Content
Most of the plots and tables displayed in the Enterprise Miner node results are based on a summary of the data, not the full training data since it can be large. But one way to get a residual plot is as follows:
1) With your modeling node selected, click on the ellipsis for Exported Data from the properties panel:
2) Select the TRAIN data, then click the Explore... button
3) Select Actions>Plot
4) Select Scatter to create a scatter plot of residuals
5) Click on R_target (where target represents your target name) and set Y for the Role
6) Select the predicted values, P_target, or an input variable, or any other variable, and set X for the Role
7) Click on Finish to create your scatter plot
- Mark as New
- Bookmark
- Subscribe
- Mute
- RSS Feed
- Permalink
- Report Inappropriate Content
Thank you!

- Mark as New
- Bookmark
- Subscribe
- Mute
- RSS Feed
- Permalink
- Report Inappropriate Content
Hi,
this solution also works for residual plots that should base on the validation data set (this is what I'd like to do ![]() ) .
) .
However, I'm wondering whether it's also possible to generate these plots based on validation data using the SAS EM graphical nodes. But as far as I can see the MultiPlot node for instance only processes the training data. Is that correct? Or is there a workaround?
Thanks for any hint,
Jan
.jpg")
Catch up on SAS Innovate 2026
Nearly 200 sessions are now available on demand with the SAS Innovate Digital Pass.
Explore Now →Use this tutorial as a handy guide to weigh the pros and cons of these commonly used machine learning algorithms.

Find more tutorials on the SAS Users YouTube channel.
-
5 replies
-
05-20-2015 11:18 AM
-
7623 views
-
7 likes
-
5 in conversation
-
