- Home
- /
- Analytics
- /
- SAS Data Science
- /
- Re: Easier way to label all Segments (concurrently) in Enterprise Mine...
- RSS Feed
- Mark Topic as New
- Mark Topic as Read
- Float this Topic for Current User
- Bookmark
- Subscribe
- Mute
- Printer Friendly Page
- Mark as New
- Bookmark
- Subscribe
- Mute
- RSS Feed
- Permalink
- Report Inappropriate Content
Hi,
Can anyone please help me out with this query which I had posted once earlier?
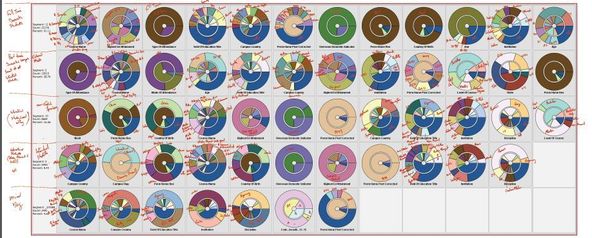
In the segment profile on enterprise miner (for eg. as in the cluster segments in the below figure), is there an option of 'labeling' (or customizing) all the segment inputs at the same time. (I thought it's extremely laborious to double click each input and individually editing their graph properties, to label them)

Really appreciate your help.
Cheers
Roby
- Mark as New
- Bookmark
- Subscribe
- Mute
- RSS Feed
- Permalink
- Report Inappropriate Content
I hope that I am answering your question. When you say that you want to label all of the segment inputs, I am assuming you want to replace the default variable label used as a footnote in the profile plots. If I double click a particular input profile for a particular segment, I get an isolated window that contains just that plot. If I right-click in a white area of the plot and select "Graph Properties...", I can select the Title/Footnote tab and change the Text for Footnote. By default, this Text value for the Footnote is the label of the input variable in the original SAS data set that produced the data source for SAS Enterprise Miner. By default, the horizontal axis has no text label, so technically I am describing the changing of a footnote, not the changing of a label. Furthermore, even if I change the individual profile plot that was obtained by double-clicking, the original plots in the profile window are unaffected by any change that I make.
If the above description is not accurate, then my solution may not be useful. I could argue that you just need to supply good variable labels for any SAS data set to be used within SAS Enterprise Miner. However, I can imagine situations where you want to modify the labels depending on how the variable is used or displayed.
I have attached a program that can be opened in a SAS Code node, modified as desired, and inserted before a Segment Profile node. The program provides a template for a solution, with two possible approaches to the problem. Both solutions modify the original input variable labels in the exported SAS training data. The Profile window will exhibit footnotes for each input consistent with the changes made to the labels. The amount of time to create the new labels should be much faster than the time to customize each plot. [Tested using SAS Enterprise Miner 14.2.]
Regards,
Terry
- Mark as New
- Bookmark
- Subscribe
- Mute
- RSS Feed
- Permalink
- Report Inappropriate Content
Hi Terry,
Greatly appreciate your explanation and the solution template.
Your solution definitely saves time in modifying the labels of the profile plots.Thank You.
Sorry if I was not clear enough in the initial query, rather than replacing or modifying the labels of the training data what I was looking for was the ability to globally visualise the labels within the Segment Size pie chart on the Result pane of the Segment Profile node, without me needing to double click on each input profile for every segment and then right click to display the legend.
For the segment profile (attached) I double-clicked on over 60 input profiles and hovered on the popped-up windows to understand the segments within the pie chart, to note them down. It would be easier if there was a way to label the pie chart segments globally, rather than use the approach I followed!
Cheers
Roby

April 27 – 30 | Gaylord Texan | Grapevine, Texas
Registration is open
Walk in ready to learn. Walk out ready to deliver. This is the data and AI conference you can't afford to miss.
Register now and lock in 2025 pricing—just $495!
Use this tutorial as a handy guide to weigh the pros and cons of these commonly used machine learning algorithms.
Find more tutorials on the SAS Users YouTube channel.

