- Home
- /
- Analytics
- /
- SAS Data Science
- /
- Re: Create Decision Tree Graphs in a SAS Code Node Using %em_report
- RSS Feed
- Mark Topic as New
- Mark Topic as Read
- Float this Topic for Current User
- Bookmark
- Subscribe
- Mute
- Printer Friendly Page

- Mark as New
- Bookmark
- Subscribe
- Mute
- RSS Feed
- Permalink
- Report Inappropriate Content
Hi Guys,
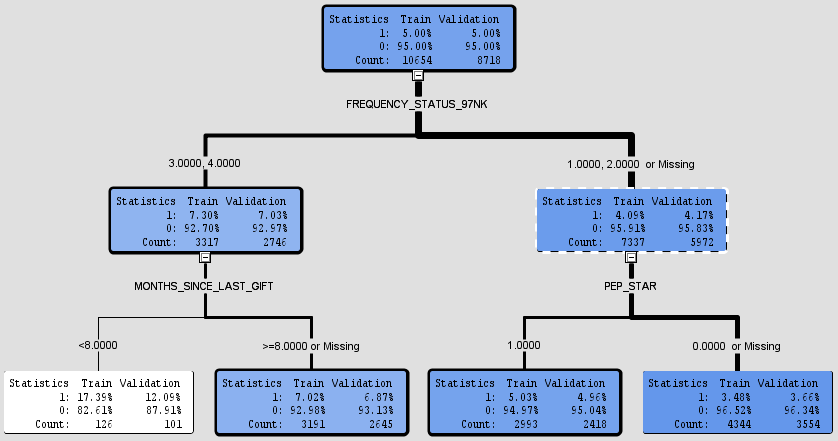
I am triing to draw a decision tree graph with Enterprise Miner SAS code node. The same way as Decision Tree node does (see below). The decision tree is created inside a loop. I guess the data for this graph is stored in the tree_plot table.
Unfortunatly i haven't found any example how to draw it.
I tried something like:
%em_register(key=tree, type=data);
data &em_user_tree;
	set &EM_LIB..tree_tree_plot_loop(where=(_loop_=1));
run;
%EM_Report(key=tree, viewtype=decisiontree, block=Table, description=%nrbquote(Trees), autodisplay=Y);
Propably it is not even em_report.
Thanks for your help,
Laszlo
Accepted Solutions

- Mark as New
- Bookmark
- Subscribe
- Mute
- RSS Feed
- Permalink
- Report Inappropriate Content
Oh okay! Sure, this is an example:
/* display tree diagram */
%em_report(key=TREE_PLOT, viewtype=DTree, id=NODE, parent=PARENT, nodetext=NODETEXT, tipText=TEXTALL, abovetext=ABOVETEXT, belowText=BELOWTEXT,
nodesize=N, nodecolor=NODECOLOR, linkwidth=LINKWIDTH, block=MODEL, description=TREE, autodisplay=Y);
- Mark as New
- Bookmark
- Subscribe
- Mute
- RSS Feed
- Permalink
- Report Inappropriate Content
I could give you the %em_report call, but unfortunately I don't think it will help since a "_loop" version of the Tree_plot data set isn't created when doing group processing. This is true for many of the results tables.
- Mark as New
- Bookmark
- Subscribe
- Mute
- RSS Feed
- Permalink
- Report Inappropriate Content
Hi Wendy, Thanks for your answer.
An EM_Reprort call, or example, that creates a decision tree graph like that will be appreciated.
Just give me any example, i will then create the table myself, in the requested format.
- Mark as New
- Bookmark
- Subscribe
- Mute
- RSS Feed
- Permalink
- Report Inappropriate Content
But, actually Tree_plot_loop is created.
- Mark as New
- Bookmark
- Subscribe
- Mute
- RSS Feed
- Permalink
- Report Inappropriate Content
Weird! It wasn't showing up for me.
- Mark as New
- Bookmark
- Subscribe
- Mute
- RSS Feed
- Permalink
- Report Inappropriate Content
Oh okay! Sure, this is an example:
/* display tree diagram */
%em_report(key=TREE_PLOT, viewtype=DTree, id=NODE, parent=PARENT, nodetext=NODETEXT, tipText=TEXTALL, abovetext=ABOVETEXT, belowText=BELOWTEXT,
nodesize=N, nodecolor=NODECOLOR, linkwidth=LINKWIDTH, block=MODEL, description=TREE, autodisplay=Y);
- Mark as New
- Bookmark
- Subscribe
- Mute
- RSS Feed
- Permalink
- Report Inappropriate Content
Thanks Wendy,
All the columns in the table are the same, as you called them.
Unfortunately I get an error, that the parameter is not ABOVETEXT, BELOWTEXT is not correct. (see below)
MLOGIC(EM_REPORT): Parameter PARENT has value PARENT
MLOGIC(EM_REPORT): Parameter NODETEXT has value NODETEXT
MLOGIC(EM_REPORT): Parameter TIPTEXT has value TEXTALL
ERROR: The keyword parameter ABOVETEXT was not defined with the macro.
ERROR: The keyword parameter BELOWTEXT was not defined with the macro.
If i remove these parameters from the macro call, than i get an empty graph.
Maybe it is a problem but I am using "SAS Enterprise Miner 12.1".
I also tried to draw the graph, after a simple decision node tree, using its simple tree_plot output. It did not help.
Is there any way to figure out the macro call in the decision tree itself? I have checked the logs, but i couldn't find anything usefull.
Or is there any documentation about this topic.
Thanks,
Laszlo
- Mark as New
- Bookmark
- Subscribe
- Mute
- RSS Feed
- Permalink
- Report Inappropriate Content
I also tried to create a dataset that simply shows a single node. It did not helped, empty graph.
%em_register(key=tree_plot, type=data);
data &em_user_tree_plot;
NODE=1; parent=.; NODETEXT="nodetext"; TEXTALL="textall"; N=100;
NODECOLOR=100; LINKWIDTH=10; ABOVETEXT="a"; BELOWTEXT="b";
output;
run;
%em_report(key=TREE_PLOT, viewtype=DTree, id=NODE, parent=PARENT, nodetext=NODETEXT, tipText=TEXTALL,
nodesize=N, nodecolor=NODECOLOR, linkwidth=LINKWIDTH, block=MODEL, description=TREE, autodisplay=Y
);
- Mark as New
- Bookmark
- Subscribe
- Mute
- RSS Feed
- Permalink
- Report Inappropriate Content
I don't have a 12.1 version of EM to try on, but it (the code below) worked for me in the latest version. If you just run a Decision Tree node (not inside of group processing), then try this, does this work in a SAS Code node for you?
%em_register(key=tree, type=data);
data &em_user_tree;
set &EM_LIB..tree_tree_plot; /* might have to adjust index to be tree2_tree_plot e.g., for the corresponding Decision Tree node */
run;
/* display tree diagram */
%em_report(key=TREE, viewtype=DTree, id=NODE, parent=PARENT, nodetext=NODETEXT, tipText=TEXTALL, abovetext=ABOVETEXT, belowText=BELOWTEXT,
nodesize=N, nodecolor=NODECOLOR, linkwidth=LINKWIDTH, block=MODEL, description=TREE, autodisplay=Y);
- Mark as New
- Bookmark
- Subscribe
- Mute
- RSS Feed
- Permalink
- Report Inappropriate Content
Thanks for your help!
Unfortunatly it didn't draw anything it gives an error.
MLOGIC(EM_REPORT): Parameter NODETEXT has value NODETEXT
MLOGIC(EM_REPORT): Parameter TIPTEXT has value TEXTALL
ERROR: The keyword parameter ABOVETEXT was not defined with the macro.
ERROR: The keyword parameter BELOWTEXT was not defined with the macro.
MLOGIC(EM_REPORT): Parameter NODESIZE has value N
MLOGIC(EM_REPORT): Parameter NODECOLOR has value NODECOLOR
If I try to remove these 2 parameters from the macro call, then it creates an empty window.


I guess that the %EM_report call has some other parameters. I am trying to find the exact macro call in the decision tree code/ or the EM_report macro definition. But i can not find it in any of the catalogs, ect.
Do you have any other ideas?
Thanks,
Laszlo
.jpg")
Catch up on SAS Innovate 2026
Nearly 200 sessions are now available on demand in the Innovate Hub.
Watch Now →Use this tutorial as a handy guide to weigh the pros and cons of these commonly used machine learning algorithms.

Find more tutorials on the SAS Users YouTube channel.
-
9 replies
-
12-12-2017 02:53 PM
-
4543 views
-
1 like
-
2 in conversation
-
