- Home
- /
- SAS Communities Library
- /
- Summarizing your data - the first step in data cleanliness
- RSS Feed
- Mark as New
- Mark as Read
- Bookmark
- Subscribe
- Printer Friendly Page
- Report Inappropriate Content
Summarizing your data - the first step in data cleanliness
- Article History
- RSS Feed
- Mark as New
- Mark as Read
- Bookmark
- Subscribe
- Printer Friendly Page
- Report Inappropriate Content
SAS programming concepts in this and other Free Data Friday articles remain useful, but SAS OnDemand for Academics has replaced SAS University Edition as a free e-learning option. Hit the orange button below to start your journey with SAS OnDemand for Academics:
I've often talked about the importance of summarising and reviewing your data before going too far into your analysis. Spending a couple of hours making sure everything "makes sense" could potentially save you a lot of time in the long run.
As I work in IT, and I have a long family history of mental health issues, I was interested to find a survey that looks at technology workers and their experiences with mental health. I wanted to see what sorts of interesting things were in this data, so a data summary is the logical first step.
Get the data
You can get the data from here; it's a standard CSV file. I would recommend not opening it in Excel first as the "Number of Employees" column has the values '1-5' and '6-25' which Excel then annoyingly converts to dates. Directly importing the data to SAS University Edition works fine, so no need to open the file beforehand.
Get started with SAS OnDemand for Academics
Get the data ready
The data was already in a format that I could use, as it was in standard CSV format.
The results
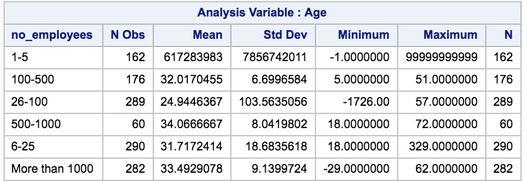
In SAS University Edition there are a couple of tasks that I use -- one is the aptly named "Summarize Data." I normally would do a thorough review of all the data, but for the purposes of this article I'm going to focus on two variables. The first is the Age of the Employee who filled out the survey. When I run my initial Summarize Data task on the dataset, (only specifying Age in the Analysis Variable section and Employees in the Classification section), I get this:
Right away, we see something bizarre - the mean age for 1-5 Employees is 617,283,983. Obviously, something went very wrong somewhere!
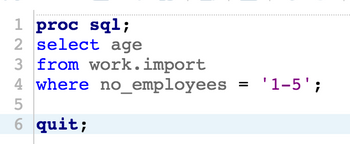
I could pinpoint the errant data a couple of ways, but I went with a quick PROC SQL query to pull out those employees who work for companies with 1 - 5 staff:
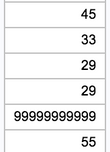
I scroll through the output and quickly see the issue:
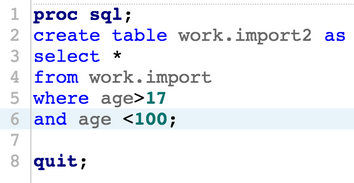
Now, if this were data where I had additional information, I may do some digging to find out this person's real age; however, for open data like this we don't have that option, so I decide to create a new table dropping those people who put an age less than 17 and over 100:
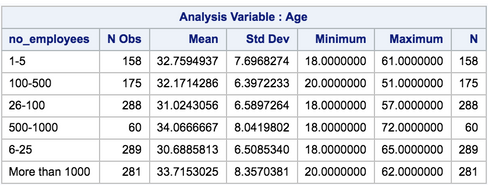
Now, when I run the query I get a much cleaner result set (and from the looks of it, there were about 8 observations that were dropped):
Interestingly enough, though there is a significant spread (18 - 72), the mean age for each group hovers around 32 years of age, with the standard deviation being fairly stable between 6 and 8 years.
Because this is a survey on mental health, let's throw in the Family History variable as a secondary Classification variable:
Once again, there seems to be consistency within the groups as far as age; within the Employee groups, there also seems to be a consistent 60/40 split between those who do not have and those who have a Family History.
The last analysis I wanted to see was grouping the output by whether or not the employees sought help for their own personal mental health issues. This is in the "Additional Roles" section and is the "Group Analysis By" option. When I run this, I get:
I realise this may seem a bit excessive, but the next image proves why this is important. When I run the task looking at Gender, I get a huge variety of responses; most are relatively easy to bucket (M, cis Male, M, etc) but if Gender is a variable of interest, understanding that "Guy-ish" and "Agender" are very different is going to be critical. If the assumption is that the responses will be the socially typical "Male" / "Female", this data will definitely throw a curve plan in your plans.
Now it’s your turn!
Did you find something else interesting in this data? Share in the comments. I’m glad to answer any questions.
SAS AI and Machine Learning Courses
The rapid growth of AI technologies is driving an AI skills gap and demand for AI talent. Ready to grow your AI literacy? SAS offers free ways to get started for beginners, business leaders, and analytics professionals of all skill levels. Your future self will thank you.
- Find more articles tagged with:
- Data for learning
- Free Data Friday

