- Home
- /
- Programming
- /
- ODS Reports
- /
- proc report to excel - formating questions...
- RSS Feed
- Mark Topic as New
- Mark Topic as Read
- Float this Topic for Current User
- Bookmark
- Subscribe
- Mute
- Printer Friendly Page

- Mark as New
- Bookmark
- Subscribe
- Mute
- RSS Feed
- Permalink
- Report Inappropriate Content
I posted something similar around August 2011 and managed to "find" a workaround solution. In my orginal post, I described how I wanted to use proc report to create a table of values for varios categories. Immediately after this table, I wanted another table that would show growth rate for all the categories above for select years (1990-2000,2000-2010,2010-2015,2010-2022). After not having any luck creating these growth rates inside proc report, my workaround solution involves creating a temporary dataset to hold these growth rates and then using another proc report statement to display both tables in one sheet. I am creating several tables with eaching having a growth rate table below. By using the "sheet interval" option in excel tagsets ods destination, I am able to accomplish about 90% of what I need. However, I am stuck on some issues relating to formatting values.
My requests/questions to the board:
(1) In the first proc report, I am using the style overide format STYLE(column)={TAGATTR='format:#,##0'}. For a few columns I would like to use STYLE(column)={TAGATTR='format:#,###.##'} that is display up to 2 decimal places to the right. However, if the value in the column is zero, I get a period. Is there a way to display a zero for values that are zero but display the value up to 2 decimal places to the right?
(2) Similar to above but applied to the second proc report - this would be the growth rate table. I would like to display the test '--' for entries where the growth rate is zero - otherwise display the value.
(3) In the second proc report (dealing with the growth rates), I would like to insert the text "Annual Growth Rates (%)" but I would like the font to be bold. The code I am using on the compute statement does not accomplish this.
Thanks
---------------------- code--------------------------------------------------------
proc template ;
define style styles.Cecforms ;
parent = styles.sansPrinter ;
class fonts /
'TitleFont' = ("Arial",3,bold)
'headingFont' = ("Arial",2)
'docFont' = ("Arial",2)
;
class table /
borderspacing = 0
cellpadding = 8
borderrightcolor=black
borderleftcolor=black
borderleftwidth=2
bordertopcolor=white
borderbottomcolor=white
borderrightwidth=2
bordertopwidth=2
borderbottomwidth=2
;
class header /
background = white
borderrightcolor=black
borderleftcolor=black
borderleftwidth=2
bordertopcolor=black
borderbottomcolor=black
borderrightwidth=2
bordertopwidth=2
borderbottomwidth=2
;
class column /
borderrightcolor=black
borderleftcolor=black
borderleftwidth=2
bordertopcolor=white
borderbottomcolor=white
borderrightwidth=2
bordertopwidth=0 /* 2 */
borderbottomwidth=1
;
end ;
run ;
ods tagsets.excelxp
file = "&link1\test1.xls"
style = Cecforms ;
ods tagsets.ExcelXP options(autofit_height = 'no'
zoom='80'
width_fudge='0.75'
embedded_titles = 'yes'
row_heights = '10'
center_horizontal = 'yes'
) ;
ods tagsets.ExcelXP options(sheet_interval = 'proc') ;
ods tagsets.ExcelXP options(sheet_interval = 'none'
sheet_name="Utility Form 1.2-Mid"
absolute_column_width ='10,10,10,10,12,10,10,10'
row_heights = '12'
) ;
title1 "Form 1.2 - Utility Planning Area" ;
title2 "Staff Revised Forecast - Mid Demand Case" ;
title3 "Net Energy for Load (GWh)" ;
/* create table for net energy for load */
proc report data = Net_load nowd split ='\' ;
column Year Mid_c Mid_l Mid_gg Mid_sgnopv Mid_sgpv Mid_sgt Mid_net ;
define Year / display ;
define Mid_c / "Total\Consumption" display STYLE(column)={TAGATTR='format:#,##0'} ;
define Mid_l / "Net Losses" display STYLE(column)={TAGATTR='format:#,##0'} ;
define Mid_gg / "Gross\Generation" display STYLE(column)={TAGATTR='format:#,##0'} ;
define Mid_sgnopv / "Non-PV\Self Generation" display STYLE(column)={TAGATTR='format:#,##0'} ;
define Mid_sgpv / "PV" display STYLE(column)={TAGATTR='format:#,##0'} ;
define Mid_sgt / "Total\Private\Supply" display STYLE(column)={TAGATTR='format:#,##0'} ;
define Mid_net / "Net Energy\for Load" display STYLE(column)={TAGATTR='format:#,##0'} ;
where put(PAN,Pa_id.) = "PGE" ;
quit ;
/* create table of growth rates */
/* blank out title statements */
title1 ;
title2 ;
title3 ;
/* now the growth rate table */
proc report data = Grwth_net nowd split ='\'
/*style(report)=[rules=none frame=void]*/
style(column header)=[borderrightcolor=white borderleftcolor=white
borderleftwidth=1 borderrightwidth=1
borderbottomwidth=1 bordertopwidth=1
borderbottomcolor=white bordertopcolor=white ] ;
column Period Mid_c2 Mid_l2 Mid_gg2 Mid_sgnopv2 Mid_sgpv2 Mid_sgt2 Mid_net2 ;
define Period / "" display style(column)={tagattr='format:###.##%'} ;
define Mid_c2 / "" display style(column)={tagattr='format:###.##%'} ;
define Mid_l2 / "" display style(column)={tagattr='format:###.##%'} ;
define Mid_gg2 / "" display style(column)={tagattr='format:###.##%'} ;
define Mid_sgnopv2 / "" display style(column)={tagattr='format:###.##%'} ;
define Mid_sgpv2 / "" display style(column)={tagattr='format:###.##%'} ;
define Mid_sgt2 / "" display style(column)={tagattr='format:###.##%'} ;
define Mid_net2 / "" display style(column)={tagattr='format:###.##%'} ;
compute before _page_ / style=[font_weight = bold font_size = 5 just= left] ;
line "Annual Growth Rates (%)" ;
endcomp ;
where put(PAN,Pa_id.) = "Utility" ;
quit ;
/* now close ods destination */
ods tagsets.excelxp close ;

- Mark as New
- Bookmark
- Subscribe
- Mute
- RSS Feed
- Permalink
- Report Inappropriate Content
Hi:
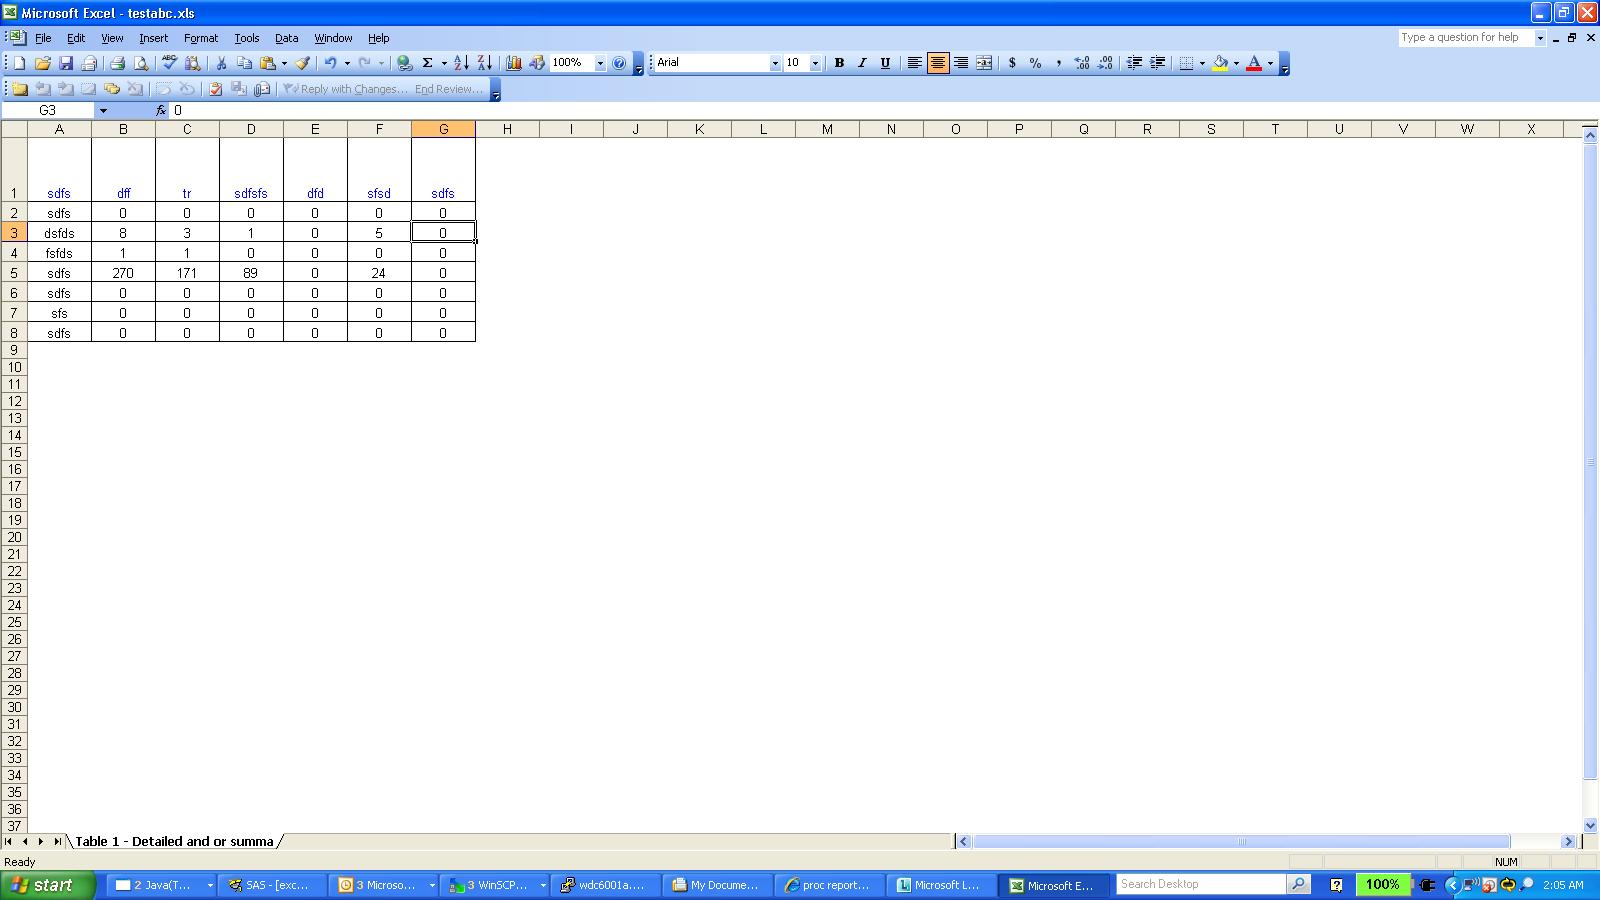
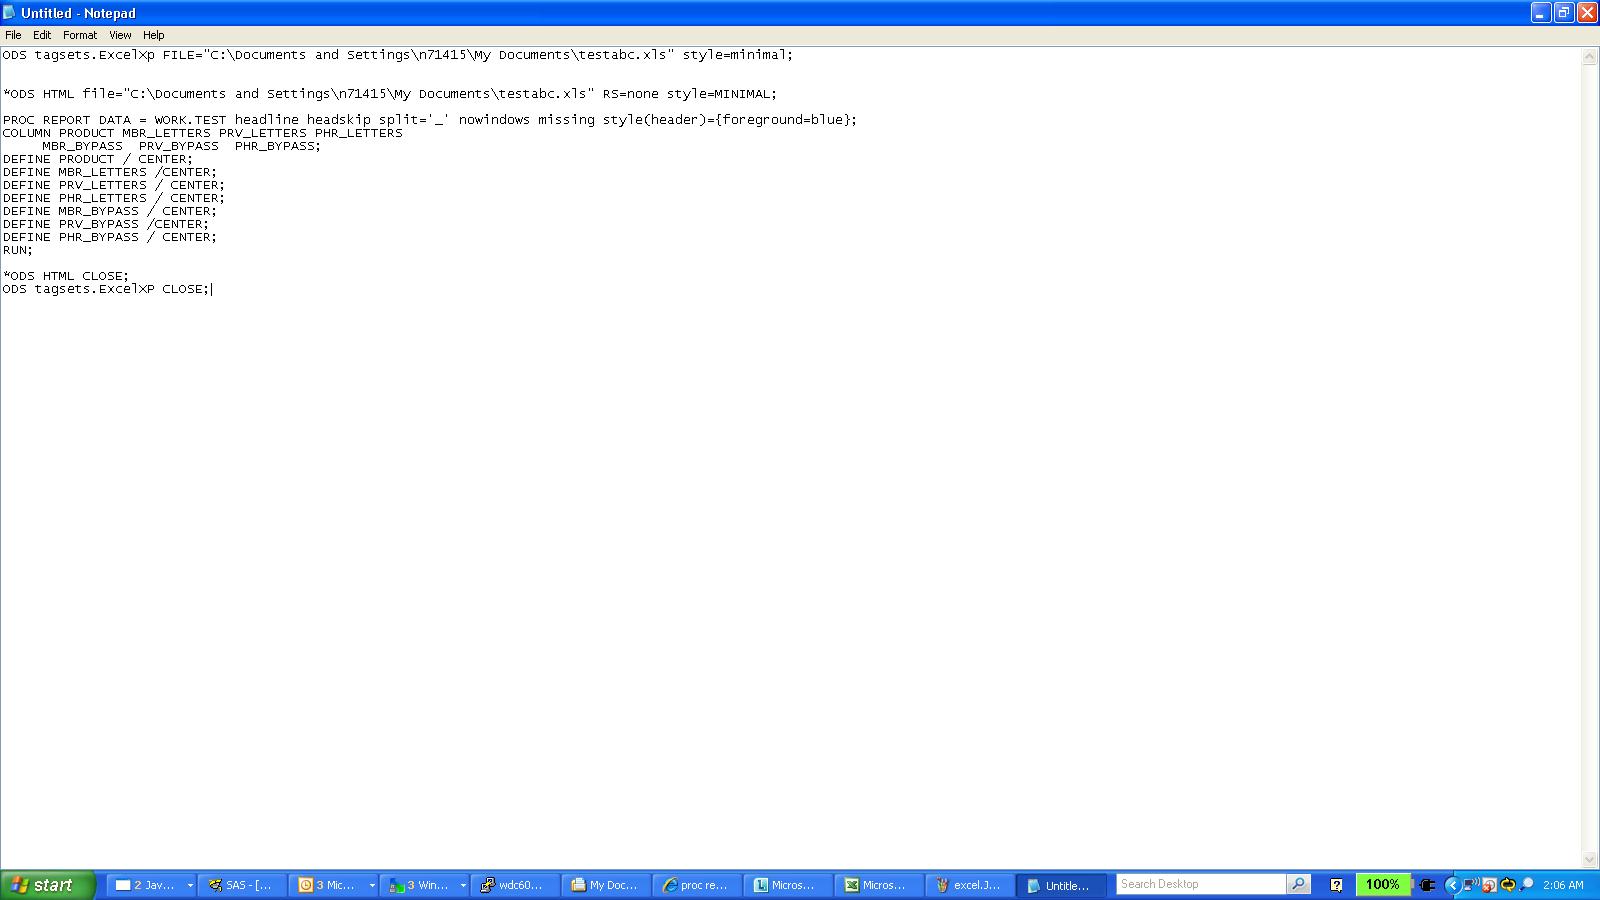
When I run a simplified version of your code (to test your #3), I do see bolding in the text string "Annual Growth Rates (%)" as shown in the attached screen shots. In the first screen shot, there was only 1 table, in the second screenshot, there were two tables. I prefer to specify my font_size in PT units because if you specify a unit of measure like a relative 5, then you are forcing Excel to convert from relative HTML font sizing to absolute PT sizes. I think it's just easier to specify point sizes directly. As you can see, both instances of using the STYLE override worked for me, when I highlight the cell in question, the Bold indicator is ON and the font size is 12 pt.
If you run my code and get the same results I do, then I would recommend taking a closer look at your style template. You can open a track with Tech Support for more help with style templates. If you run my code and do NOT get the same results that I show, then I would also recomend working with Tech Support on this issue.
For your #1 and possibly #2 questions, in order to format a zero differently from other numbers in the cell, you would need to send a longer set of custom format instructions from SAS to Excel using the TAGATTR method. I show an example of this on pages 8-10 of my SAS Global Forum paper: http://support.sas.com/resources/papers/proceedings11/266-2011.pdf
Or, you could use a user-defined format to format 0 as --, as shown in the example below where I make the AGEF user-defined format. When the output is opened in Excel, the -- shows for Alfred and Alice's rows on the report.
cynthia
ods listing close;
** Test LINE formatting with STYLE=;
ods tagsets.excelxp file='c:\temp\test_bold.xml'
style=sansprinter;
** with one procedure step;
proc report data=sashelp.class(obs=3) nowd;
column name age height weight;
compute before _page_ / style=[font_weight = bold
font_size=12pt just=l] ;
line "Annual Growth Rates (%)" ;
endcomp ;
run;
ods _all_ close;
ods tagsets.excelxp file='c:\temp\test_bold2.xml'
style=sansprinter
options(sheet_interval='none');
** with 2 procedure steps;
proc report data=sashelp.class(obs=2) nowd;
column name sex age height weight;
title 'A Title Statement';
run;
title;
proc report data=sashelp.class(obs=3) nowd;
column name age height weight;
compute before _page_ / style=[font_weight = bold
font_size=12pt just=l] ;
line "Annual Growth Rates (%)" ;
endcomp ;
run;
ods _all_ close;
** format 0 as --;
data class;
set sashelp.class;
if name in ('Alfred', 'Alice') then age = 0;
run;
proc format;
value agef 0='--';
run;
ods tagsets.excelxp file='c:\temp\agefmt.xml'
style=sansprinter;
proc report data=class(obs=5) nowd;
column name age height weight;
define age / format=agef.;
run;
ods tagsets.excelxp close;


- Mark as New
- Bookmark
- Subscribe
- Mute
- RSS Feed
- Permalink
- Report Inappropriate Content
Thanks for your reply. I will follow up with SAS on the style template.
I tried using a format to get 0 values displayed as '--' as suggested by you but I seem to have other issues crop up. Values after 2006 show up as ** (could it be due to a length issue?). The growth does show '--' when the value is zero but it rounds up significantly and this is not desireable (87.19% becomes 90%). Also, in the growth rate, the display doe not show 2 decimals to the right (87.19% becomes 90.%). I will look at the paper and see if I can find something to get me out of this jam.
- Mark as New
- Bookmark
- Subscribe
- Mute
- RSS Feed
- Permalink
- Report Inappropriate Content
I just wanted to add that if I make the change to the proc format as belows:
proc format;
value zerof
0='------' ; /* before: 0='--'*/
run;
Things look much better! Thanks so much!!!
- Mark as New
- Bookmark
- Subscribe
- Mute
- RSS Feed
- Permalink
- Report Inappropriate Content
Hi: Or, you could open a track with Tech Support.
My paper will show how to build a Microsoft custom format that treats zero differently from other numbers in the cell, but rounding issues are between your data and Excel and the way you specified your format. Note that in my custom format, I ONLY format zero to be '--', I do not provide ANY other instructions, which means that the numbers will display their original values. I don't know what adding a Microsoft format into the mix will do. If you use a Microsoft format, for percents, I thought that Microsoft would round appropriately.
For example, in the code below, I see that 0.1990812 rounds appropriately to 19.91% and the other percents seem to round appropriately, too. Note that I have NOT used -- for the 0, but have, instead formatted it as 0 and blue (see PCT2 column).
When you build a Microsoft format the '#' tells Microsoft to show a number ONLY if there is a number. If you want 0.24 to show as 24.00%, then you need to define your custom format with ###.00% instead of ###.##% In my code, I think I get the best results with either the TAGATTR for PCT2 or with the COMPUTE block method as shown for MAKEPCT. With the COMPUTE block method, I am able to get -- in the MAKEPCT column when the value is 0.
However, if you still find that values are being rounded inappropriately, then I would definitely recommend opening a track with Tech Support.
cynthia
*Here's the code I used for the attached screen shot;
** format 0 as --;
data class;
set sashelp.class;
if name in ('Alfred', 'Alice') then age = 0;
calcpct = age / height;
shownum = calcpct;
run;
proc format;
value agef 0='--';
run;
ods tagsets.excelxp file='c:\temp\showpct.xml'
style=sansprinter;
proc report data=class nowd;
column name age shownum calcpct calcpct=pct2 makepct;
define age / display format=agef.;
define shownum / display 'Unformatted Number';
define calcpct / display 'Simple TAGATTR'
style(column)={tagattr='format:###.##%'} ;
define pct2 / display 'Complex TAGATTR'
style(column)={tagattr='format:###.##%;[Red](###.##%);[Blue]0;'};
define makepct / computed 'Compute Block'
style(column)={just=r};
compute makepct / character length=8;
makepct = put(calcpct,percent8.2);
if calcpct = 0 then makepct = ' -- ';
endcomp;
run;
ods tagsets.excelxp close;


- Mark as New
- Bookmark
- Subscribe
- Mute
- RSS Feed
- Permalink
- Report Inappropriate Content
Hi Cynthia,
I have a doubt with the excel creation. While using PROC REPORT with ODS TAGSETS, the excel appears white in the areas where the data is not present. I want to retain the original appearance of the excel. Is there any way to override this?
This is the code I am using:
- Mark as New
- Bookmark
- Subscribe
- Mute
- RSS Feed
- Permalink
- Report Inappropriate Content
Hi:
It's not a good idea to "piggyback" your new posting onto an old posting. The fact is that your question is not at all related to this previous post. The previous post was asking about formatting for the data values inside a data cell. And your questioni is about changing the interior cell border lines when your output is opened in Excel.
Even if your question was related to the previous post, it's better for you to start a new post and reference the older post.
The bottom line on your question is that you cannot use any "internal" PROC REPORT style controls to do what you want to do. This Tech Support note shows how to do what you want, but you have to modify the TAGSET template for ExcelXP tagset. See this Tech Support note for more info: 46949 - You cannot use a style template with the ExcelXP tagset to add grid lines to the body of a w... If you have trouble using the code posted in the note, then I would suggest that you work with Tech Support for more direct help.
cynthia
.jpg")
Catch up on SAS Innovate 2026
Nearly 200 sessions are now available on demand with the SAS Innovate Digital Pass.
Explore Now →Learn how use the CAT functions in SAS to join values from multiple variables into a single value.

Find more tutorials on the SAS Users YouTube channel.
SAS Training: Just a Click Away
Ready to level-up your skills? Choose your own adventure.
-
6 replies
-
01-30-2012 12:53 PM
-
7884 views
-
3 likes
-
3 in conversation
-
