- Home
- /
- Programming
- /
- ODS Reports
- /
- help with setting format from sas ods to excel
- RSS Feed
- Mark Topic as New
- Mark Topic as Read
- Float this Topic for Current User
- Bookmark
- Subscribe
- Mute
- Printer Friendly Page

- Mark as New
- Bookmark
- Subscribe
- Mute
- RSS Feed
- Permalink
- Report Inappropriate Content
hi all,
please help! i have a lot of tables to create manually if i can't figure this out!
i would like to format my tables in excel such that: there is an outline or box line enclosing my table, my column headers are enclosed in a border, and each column has lines (bolded). my research suggests that the following options, when defining a custom style should do the trick:
rules = cols
frame = box
below is the format i am looking for:
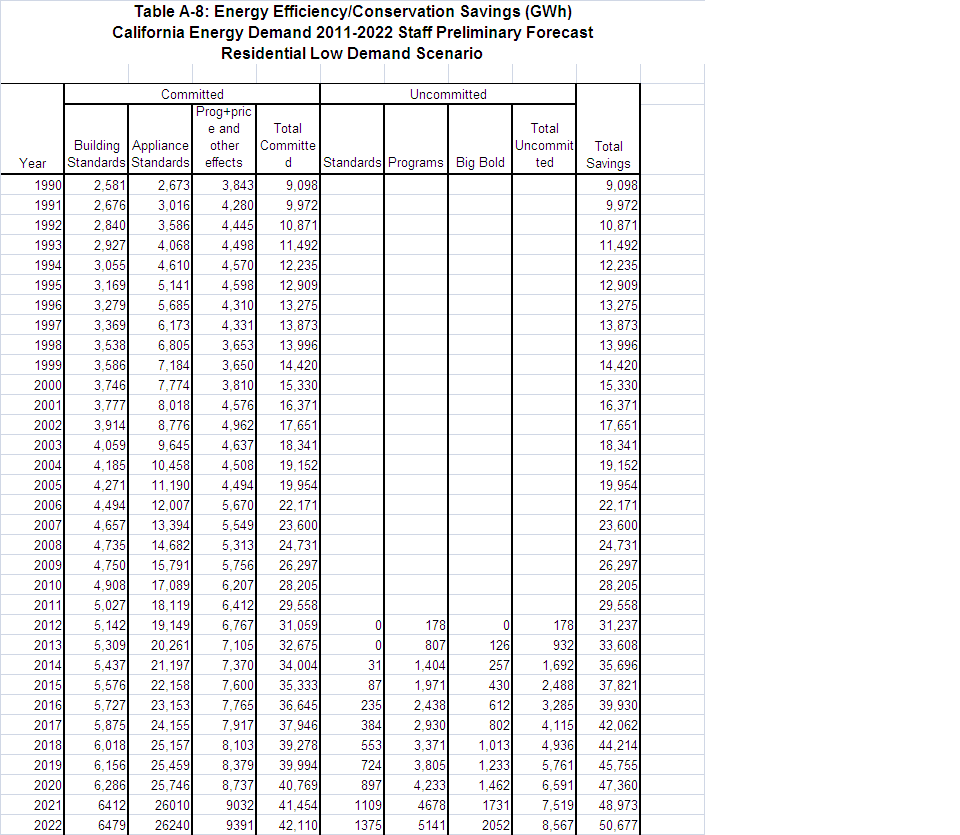
instead, i get this format:
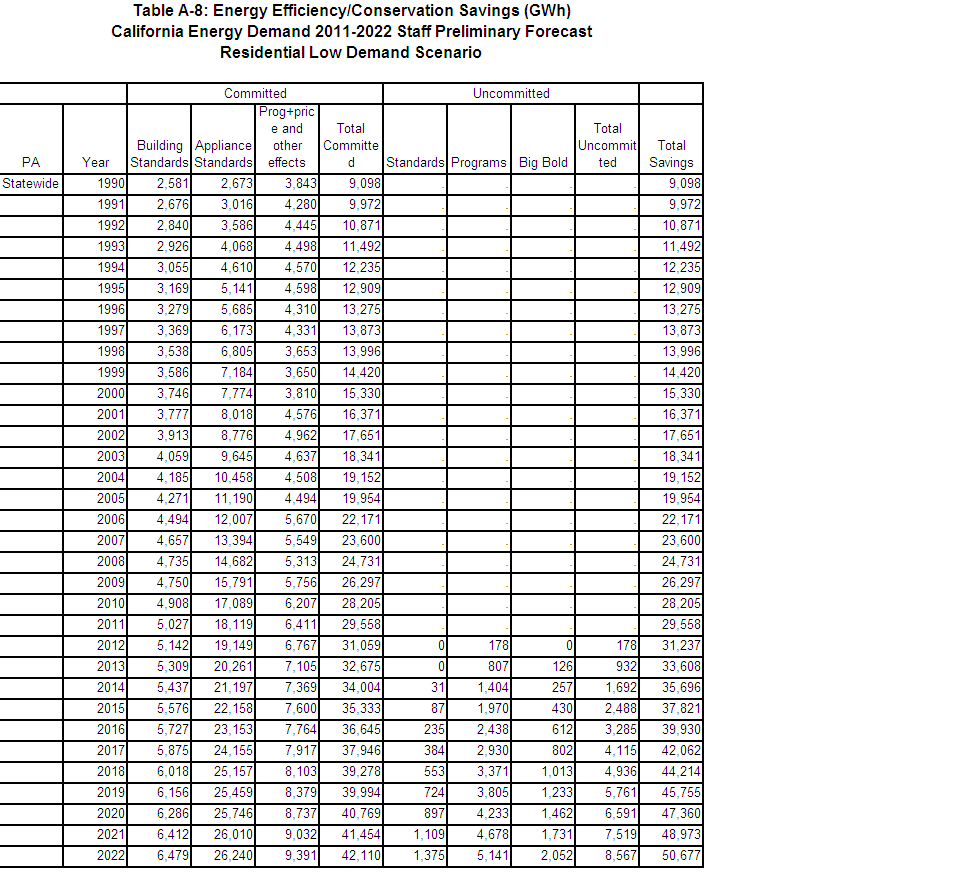
however, i am not getting the desired formatted output. Am I forgetting an option? How can I fix this?
/* set up style format */
proc template ;
define style styles.Cecforms ;
parent = styles.sansPrinter ;
class fonts /
'TitleFont' = ("Arial",3,bold)
'headingFont' = ("Arial",2)
'docFont' = ("Arial",2)
;
class table /
borderspacing = 0
borderwidth = 2
rules = cols
frame = box
cellpadding = 8
;
class header /
background = white
;
end ;
run ;
/* set up macro to create tables */
%macro Cefftab ;
%let Uncnt = Statewide PGE SCE SDGE SMUD LADWP ;
%let Scen = Low Demand,Mid Demand,High Demand ;
ods listing close ;
ods tagsets.excelxp
body = 'C:\Documents and Settings\agautam\Desktop\Selfgen\CED 2011\Preliminary\Summary_files_chris\summary_ee\EE_Tables_test2.xml'
style = Cecforms ;
%let i = 1 ;
%do %until (%scan(&Uncnt,&i) eq ) ;
%let tempid = %scan(&Uncnt,&i) ;
%let j = 1 ;
%do %until (%scan(%quote(&Scen),&j,',') eq ) ;
%let tempsc = %scan(%quote(&Scen),&j,',') ;
ods tagsets.ExcelXP options(absolute_column_width ='8,4,8,8,8,8,8,8,8,12,8'
width_fudge='0.75' embedded_titles = 'yes') ;
ods tagsets.ExcelXP options(sheet_name="&tempid.rescon-&tempsc") ;
title1 "Table A-8: Energy Efficiency/Conservation Savings (GWh)" ;
title2 "California Energy Demand 2011-2022 Staff Preliminary Forecast " ;
title3 " Residential &tempsc Scenario" ;
proc report data = Rescon nowd split ='\' ;
column PA Year ('Committed' BS AS Prog_price_and_other_effects total_committed)
('Uncommitted' Standards Programs Big_Bold total_uncommitted) total_savings ;
define PA / group ;
define Year / group ;
define BS / 'Building\Standards' analysis STYLE(column)={TAGATTR='format:#,##0'} ;
define AS / 'Appliance\Standards' analysis STYLE(column)={TAGATTR='format:#,##0'} ;
define Prog_price_and_other_effects / analysis STYLE(column)={TAGATTR='format:#,##0'} ;
define total_committed / 'Total\Committed ' analysis STYLE(column)={TAGATTR='format:#,##0'} ;
define Standards / analysis STYLE(column)={TAGATTR='format:#,##0'} ;
define Programs / analysis STYLE(column)={TAGATTR='format:#,##0'} ;
define Big_Bold / analysis STYLE(column)={TAGATTR='format:#,##0'} ;
define total_uncommitted / 'Total\Uncommitted' analysis STYLE(column)={TAGATTR='format:#,##0'} ;
define total_savings / 'Total\Savings' analysis STYLE(column)={TAGATTR='format:#,##0'} ;
where PA eq "&tempid" and Scenario eq "&tempsc" and Year between 1990 and 2022 ;
run ;
ods tagsets.ExcelXP options(sheet_name="&tempid.respeak-&tempsc") ;
title1 "Table A-8: Energy Efficiency/Conservation Peak Savings (MW)" ;
title2 "California Energy Demand 2011-2022 Staff Preliminary Forecast " ;
title3 "Residential &tempsc Scenario" ;
proc report data = Respeak nowd split ='\' ;
column PA Year ('Committed' BS AS Prog_price_and_other_effects total_committed)
('Uncommitted' Standards Programs Big_Bold total_uncommitted) total_savings ;
define PA / group ;
define Year / group ;
define BS / 'Building\Standards' analysis STYLE(column)={TAGATTR='format:#,##0'} ;
define AS / 'Appliance\Standards' analysis STYLE(column)={TAGATTR='format:#,##0'} ;
define Prog_price_and_other_effects / analysis STYLE(column)={TAGATTR='format:#,##0'} ;
define total_committed / 'Total\Committed ' analysis STYLE(column)={TAGATTR='format:#,##0'} ;
define Standards / analysis STYLE(column)={TAGATTR='format:#,##0'} ;
define Programs / analysis STYLE(column)={TAGATTR='format:#,##0'} ;
define Big_Bold / analysis STYLE(column)={TAGATTR='format:#,##0'} ;
define total_uncommitted / 'Total\Uncommitted' analysis STYLE(column)={TAGATTR='format:#,##0'} ;
define total_savings / 'Total\Savings' analysis STYLE(column)={TAGATTR='format:#,##0'} ;
where PA eq "&tempid" and Scenario eq "&tempsc" and Year between 1990 and 2022 ;
run ;
ods tagsets.ExcelXP options(sheet_name="&tempid.nonrescon-&tempsc") ;
title1 "Table A-8: Energy Efficiency/Conservation Savings (GWh)" ;
title2 "California Energy Demand 2011-2022 Staff Preliminary Forecast " ;
title3 "Non-residential &tempsc Scenario" ;
proc report data = Nonrescon nowd split ='\' ;
column PA Year ('Committed' BS AS Prog_price_and_other_effects total_committed)
('Uncommitted' Standards Programs Big_Bold total_uncommitted) total_savings ;
define PA / group ;
define Year / group ;
define BS / 'Building\Standards' analysis STYLE(column)={TAGATTR='format:#,##0'} ;
define AS / 'Appliance\Standards' analysis STYLE(column)={TAGATTR='format:#,##0'} ;
define Prog_price_and_other_effects / analysis STYLE(column)={TAGATTR='format:#,##0'} ;
define total_committed / 'Total\Committed ' analysis STYLE(column)={TAGATTR='format:#,##0'} ;
define Standards / analysis STYLE(column)={TAGATTR='format:#,##0'} ;
define Programs / analysis STYLE(column)={TAGATTR='format:#,##0'} ;
define Big_Bold / analysis STYLE(column)={TAGATTR='format:#,##0'} ;
define total_uncommitted / 'Total\Uncommitted' analysis STYLE(column)={TAGATTR='format:#,##0'} ;
define total_savings / 'Total\Savings' analysis STYLE(column)={TAGATTR='format:#,##0'} ;
where PA eq "&tempid" and Scenario eq "&tempsc" and Year between 1990 and 2022 ;
run ;
ods tagsets.ExcelXP options(sheet_name="&tempid.nonrespeak-&tempsc") ;
title1 "Table A-8: Energy Efficiency/Conservation Peak Savings (MW)" ;
title2 "California Energy Demand 2011-2022 Staff Preliminary Forecast " ;
title3 "Non-residential &tempsc Scenario" ;
proc report data = Nonrespeak nowd split ='\' ;
column PA Year ('Committed' BS AS Prog_price_and_other_effects total_committed)
('Uncommitted' Standards Programs Big_Bold total_uncommitted) total_savings ;
define PA / group ;
define Year / group ;
define BS / 'Building\Standards' analysis STYLE(column)={TAGATTR='format:#,##0'} ;
define AS / 'Appliance\Standards' analysis STYLE(column)={TAGATTR='format:#,##0'} ;
define Prog_price_and_other_effects / analysis STYLE(column)={TAGATTR='format:#,##0'} ;
define total_committed / 'Total\Committed ' analysis STYLE(column)={TAGATTR='format:#,##0'} ;
define Standards / analysis STYLE(column)={TAGATTR='format:#,##0'} ;
define Programs / analysis STYLE(column)={TAGATTR='format:#,##0'} ;
define Big_Bold / analysis STYLE(column)={TAGATTR='format:#,##0'} ;
define total_uncommitted / 'Total\Uncommitted' analysis STYLE(column)={TAGATTR='format:#,##0'} ;
define total_savings / 'Total\Savings' analysis STYLE(column)={TAGATTR='format:#,##0'} ;
where PA eq "&tempid" and Scenario eq "&tempsc" and Year between 1990 and 2022 ;
run ;
%let j = %eval(&j + 1) ;
%end ;
%let i = %eval(&i + 1) ;
%end ;
ods tagsets.excelxp close ;
%mend Cefftab ;
/* call macro to create tables */
%Cefftab
note: i just attached a small sample of data for the data set "Nonrescon"
- Mark as New
- Bookmark
- Subscribe
- Mute
- RSS Feed
- Permalink
- Report Inappropriate Content
i hate to bump this thread but any replies would be greatly appreciated. i have a coworker who is looking into coding some lines of vba to get the desired format. it seems redundant to have to do this!

- Mark as New
- Bookmark
- Subscribe
- Mute
- RSS Feed
- Permalink
- Report Inappropriate Content
Include a simple example with data or that uses data we all have SASHELP SHOES or CLASS. I don't see much difference between the have and need tables at the top of your original post.

- Mark as New
- Bookmark
- Subscribe
- Mute
- RSS Feed
- Permalink
- Report Inappropriate Content
If you don't want PA displayed in the report, why don't you just either exclude it or define it to be display noprint?
- Mark as New
- Bookmark
- Subscribe
- Mute
- RSS Feed
- Permalink
- Report Inappropriate Content
The column "PA" is needed - I think I grabbed an older version of the table I am trying to duplicate.
- Mark as New
- Bookmark
- Subscribe
- Mute
- RSS Feed
- Permalink
- Report Inappropriate Content
Hi, I just uploaded a small sample of the data set "Nonrescon". The difference is in the borders. I want a border for each column and an overall border for the table and headers but instead I have borders for columns and rows.
- Mark as New
- Bookmark
- Subscribe
- Mute
- RSS Feed
- Permalink
- Report Inappropriate Content
You might find the following paper helpful in solving the problem:
- Mark as New
- Bookmark
- Subscribe
- Mute
- RSS Feed
- Permalink
- Report Inappropriate Content
thanks for the link but unfortunately, this was a bit too much for me to to go through given my timeline. i'll try to take a look at this later on though.

- Mark as New
- Bookmark
- Subscribe
- Mute
- RSS Feed
- Permalink
- Report Inappropriate Content
Hi:
Rather that concentrate entirely on PROC REPORT, I think you need to work with Style templates, possibly STYLE= overrides and investigating how to make your style template work. It is a complicated enough template and PROC REPORT that you may find it faster to work with Tech Support on this question.
cynthia
- Mark as New
- Bookmark
- Subscribe
- Mute
- RSS Feed
- Permalink
- Report Inappropriate Content
thanks for the reply. i had not considered the style overrides but will explore them in future work.
- Mark as New
- Bookmark
- Subscribe
- Mute
- RSS Feed
- Permalink
- Report Inappropriate Content
a coworker came with a possible solution that gets me to where i want and it does use style overrides - though i would share with everyone else.
style(column)={borderrightcolor=black borderleftcolor=black
borderleftwidth=1 bordertopcolor=white borderbottomcolor=white
borderrightwidth=1 bordertopwidth=1 borderbottomwidth=1}
.jpg")
Catch up on SAS Innovate 2026
Nearly 200 sessions are now available on demand in the Innovate Hub.
Watch Now →Learn how use the CAT functions in SAS to join values from multiple variables into a single value.

Find more tutorials on the SAS Users YouTube channel.
SAS Training: Just a Click Away
Ready to level-up your skills? Choose your own adventure.
-
10 replies
-
08-11-2011 05:58 PM
-
5246 views
-
0 likes
-
4 in conversation
-
