- Home
- /
- Programming
- /
- ODS Reports
- /
- Re: add diagonal line to empty cell in report table
- RSS Feed
- Mark Topic as New
- Mark Topic as Read
- Float this Topic for Current User
- Bookmark
- Subscribe
- Mute
- Printer Friendly Page

- Mark as New
- Bookmark
- Subscribe
- Mute
- RSS Feed
- Permalink
- Report Inappropriate Content
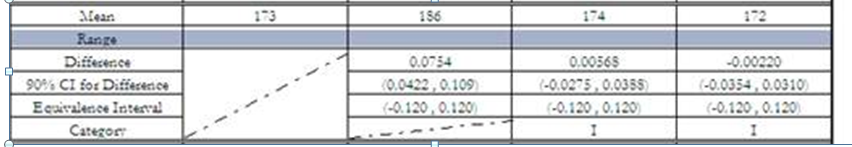
Is there a way to add diagonal lines ( instead of using NA, ., or -) to a cell of report table that has missing value? ( see above table) I have not found a way using proc report.
thanks
dyan

- Mark as New
- Bookmark
- Subscribe
- Mute
- RSS Feed
- Permalink
- Report Inappropriate Content
Hi:
This looks like only a piece of the report. How did you remove the interior table lines underneath the column that is under Mean of 173??? There would normally be interior table lines in that empty area, It may be possible to put an image into a single cell (such as you show for Category under the column for Mean of 186), but by default, spanning an entire set of cells with one image would be hard to do. It is much easier to put 1 image into 1 cell. However, with a predefined image, it would be hard to get the angle of the diagonal line exactly correct, as shown in the attached screen shot -- in the column for Age=16 in the first row (there are no females aged 16).
You may want to work with Tech Support on this question...in a situation like this it is useful to see your data and ALL your PROC REPORT code, including the ODS statements.
cynthia

- Mark as New
- Bookmark
- Subscribe
- Mute
- RSS Feed
- Permalink
- Report Inappropriate Content
Thanks, Cynthia, this is a table done by excel. I want to produce the table in the exact same format in sas ods output. I could produce the table except adding diagonal line ---- I did not remove the line, and just make the borderstyle=hidden. so there is still interior line in the empty area.
- Mark as New
- Bookmark
- Subscribe
- Mute
- RSS Feed
- Permalink
- Report Inappropriate Content
Hi,
That makes sense (that you turned the borders off) -- but that means you would still put an image into each cell, you cannot put one image that will span multiple cell boundaries. So you'd see 4 or 5 diagonal lines -- instead of just 1.
I didn't bother hiding the borders in the attached screen shot, but I did add a column for age 17, which generates 2 empty cells in the column. I can only get 2 diagonal lines...not one line that will span both cells. Hiding the borders doesn't make the invisible cell boundaries go away. Again, I think your best bet for help is to work with Tech Support. It may not be possible to do what you want to do, especially since you didn't indicate what your destination of interest is (RTF?? HTML?? TAGSETS.EXCELXP??)
cynthia


- Mark as New
- Bookmark
- Subscribe
- Mute
- RSS Feed
- Permalink
- Report Inappropriate Content
Another workaround is to make a proper size photo to hold diagonal line, and use preimage= style to fill in the cell.
Ksharp
- Mark as New
- Bookmark
- Subscribe
- Mute
- RSS Feed
- Permalink
- Report Inappropriate Content
Hi:
That's exactly what my screen shots illustrate. The OP showed the original screen shot that looks like just 1 cell with a diagonal line, but, in reality, it is 5 cells with the interior lines hidden. The interior lines are still there. So the OP has 5 cells, not 1 cell. There isn't a way to put 1 image OVER 5 cells with style overrides. The PREIMAGE attribute applies at either the cell level or before or after the table or before or after the page (in some destinations).
In my first screen shot, I used the PREIMAGE attribute to put an image into 1 cell (the cell for F, age 16). In my second screen shot, I used the PREIMAGE attribute to put an image into 2 cells (the cell for F, age 17 and the cell for M, age17).
In Word or Excel or with an HTML file, the OP might be able to post-process the file (using Word or Excel macros or by editing the HTML) to turn the 5 cells into 1 cell and then put the appropriate image; however, my understanding was that the number of cells with missing might change from run to run, so taking on the post-processing effort could be problematic.
Using
OPTIONS MISSING=" ";
would at least turn any period (.) in an empty cell to a space for display purposes. But although you could put a diagonal line image into every cell with missing, I believe in the end, it would clutter up the table.
cynthia
- Mark as New
- Bookmark
- Subscribe
- Mute
- RSS Feed
- Permalink
- Report Inappropriate Content
I got feedback from the SAS tech support group:
SAS does not currently have production code that can create this kind of diagnonal line( across rows).
The report writing interface might be able to do but it is preproduction.
- Mark as New
- Bookmark
- Subscribe
- Mute
- RSS Feed
- Permalink
- Report Inappropriate Content
But you can use annotate macros to add this line .
NOTE: It is from Arthur Carpenter's Book - Complete Guide to proc report.
ods pdf style=printer
file="c:\ch10_3_3.pdf"
startpage=never;
title1;
proc report data=sashelp.class
nowd; run;
* Add the annotate macros to the autocall library;
%annomac
* Build the annotate data set;
data Annolines;
length function color $8;
retain xsys ysys '5';
* Syntax for the LINE macro;
%*LINE (x1, y1, x2, y2, color, line_type, size);
%line(.5,69.6,50.5,89.6,blue,2,20)
%line(.5,80.5,50.5,90.5,red,2,20)
%line(42.2,67,62.2,104,green,2,20)
run;
* Use the annotate data set;
proc gslide anno=annolines;
run;
quit;
ods _all_ close;
Ksharp
.jpg")
Catch up on SAS Innovate 2026
Nearly 200 sessions are now available on demand with the SAS Innovate Digital Pass.
Explore Now →Learn how use the CAT functions in SAS to join values from multiple variables into a single value.

Find more tutorials on the SAS Users YouTube channel.
SAS Training: Just a Click Away
Ready to level-up your skills? Choose your own adventure.
-
7 replies
-
01-10-2012 10:55 AM
-
5631 views
-
0 likes
-
3 in conversation
-
