- Home
- /
- Programming
- /
- ODS Reports
- /
- Re: Dynamic report using ods tagsets [how to improve your question]
- RSS Feed
- Mark Topic as New
- Mark Topic as Read
- Float this Topic for Current User
- Bookmark
- Subscribe
- Mute
- Printer Friendly Page
- Mark as New
- Bookmark
- Subscribe
- Mute
- RSS Feed
- Permalink
- Report Inappropriate Content
Hi All,
Is there any way to create a report in excel using SAS that changes data based on the selected filters?
My data has filter1 & filter2 and 4 fixed groups for both these filters. Each filters has 4 diff metrics and based on the combination of these two filters report has to be updated. I can only think of achieving this using VBA. is there any better option available if so please help me on this.
Below is the example of my output in excel. attached sample data as well.
| Filter1 | mode1 | |
| Filter2 | channel2 | |
| Groups | Units | Sales |
| A | 0 | 0 |
| B | 15 | 200 |
| C | 0 | 0 |
| D | 0 | 0 |
Please let me know if you need more information.
Thank you.
- Mark as New
- Bookmark
- Subscribe
- Mute
- RSS Feed
- Permalink
- Report Inappropriate Content
Hello @krishdy,
Your question requires more details before experts can help. Can you revise your question to include more information?
Review this checklist:
- Specify a meaningful subject line for your topic. Avoid generic subjects like "need help," "SAS query," or "urgent."
- When appropriate, provide sample data in text or DATA step format. See this article for one method you can use.
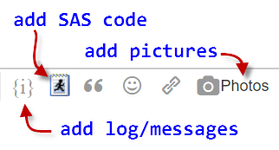
- If you're encountering an error in SAS, include the SAS log or a screenshot of the error condition. Use the Photos button to include the image in your message.
- It also helps to include an example (table or picture) of the result that you're trying to achieve.
To edit your original message, select the "blue gear" icon at the top of the message and select Edit Message. From there you can adjust the title and add more details to the body of the message. Or, simply reply to this message with any additional information you can supply.
SAS experts are eager to help -- help them by providing as much detail as you can.
This prewritten response was triggered for you by fellow SAS Support Communities member @Reeza
.- Mark as New
- Bookmark
- Subscribe
- Mute
- RSS Feed
- Permalink
- Report Inappropriate Content
Look at the TABLEEDITOR option instead of tagsets?
- Mark as New
- Bookmark
- Subscribe
- Mute
- RSS Feed
- Permalink
- Report Inappropriate Content
It's not clear what you have and what you want to achieve.
Is it pivot table like functionality to filter/display data in an interactive format?
- Mark as New
- Bookmark
- Subscribe
- Mute
- RSS Feed
- Permalink
- Report Inappropriate Content
hi,
Thanks for you reply. Yes its similar to pivot kind of feature. I got multiple filters and i dont want to create report for each of these filters.
Please let me know if you need any information.
- Mark as New
- Bookmark
- Subscribe
- Mute
- RSS Feed
- Permalink
- Report Inappropriate Content
Learn how use the CAT functions in SAS to join values from multiple variables into a single value.
Find more tutorials on the SAS Users YouTube channel.
SAS Training: Just a Click Away
Ready to level-up your skills? Choose your own adventure.


