- Home
- /
- Programming
- /
- ODS Reports
- /
- Re: Proc Tabulate + Summing over the levels, but level names to be ret...
- RSS Feed
- Mark Topic as New
- Mark Topic as Read
- Float this Topic for Current User
- Bookmark
- Subscribe
- Mute
- Printer Friendly Page

- Mark as New
- Bookmark
- Subscribe
- Mute
- RSS Feed
- Permalink
- Report Inappropriate Content
Hi,
I have a data set as:
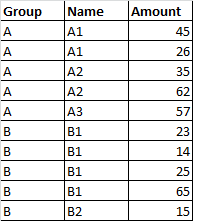
I can create a 'proc tabulate' to get:
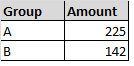
But, can I create a 'proc tabulate' to get the below results?
Thank you,
Shubha Karanth
Accepted Solutions

- Mark as New
- Bookmark
- Subscribe
- Mute
- RSS Feed
- Permalink
- Report Inappropriate Content
What I did was to create a table in Word and save as RTF and look for the raw codes. A similar approach may work for HTML to find the codes in the table. Maybe. I don't do much HTML customization as we need to have pages in my organization.
- Mark as New
- Bookmark
- Subscribe
- Mute
- RSS Feed
- Permalink
- Report Inappropriate Content
- Mark as New
- Bookmark
- Subscribe
- Mute
- RSS Feed
- Permalink
- Report Inappropriate Content
Thanks. Yes, the stacked text (one below the other) in a single cell would be acceptable.
Regards,
Shubha

- Mark as New
- Bookmark
- Subscribe
- Mute
- RSS Feed
- Permalink
- Report Inappropriate Content
Hi, by default, TABULATE will not have a sum (such as the sum for AMOUNT) spanning multiple rows. TABULATE will allow the CLASS variable for GROUP to span multiple cells for NAME, but the analysis variable won't work that way. You show your data, but you don't show your code or your destination of interest. Can you elaborate a bit more on the code you've used and the destination of interest? And maybe explain why you want the sum for AMOUNT to span all the rows for NAME.
cynthia
- Mark as New
- Bookmark
- Subscribe
- Mute
- RSS Feed
- Permalink
- Report Inappropriate Content
Sure, I believe the below code would help in diagonising the problem.
data dat;
input Group $ Name $ Amount;
cards;
A A1 45
A A1 26
A A2 35
A A2 62
A A3 57
B B1 23
B B1 14
B B1 25
B B1 65
B B2 15
;
run;
/* Table 1 */
TITLE Fig 1;
PROC TABULATE DATA=WORK.DAT;
VAR Amount;
CLASS Group / ORDER=UNFORMATTED MISSING;
CLASS Name / ORDER=UNFORMATTED MISSING;
TABLE
/* Row Dimension */
Group*Name,
/* Column Dimension */
Amount* Sum;
;
RUN; QUIT;
/* Table 2 */
TITLE Fig 2;
PROC TABULATE DATA=WORK.DAT;
VAR Amount;
CLASS Group / ORDER=UNFORMATTED MISSING;
CLASS Name / ORDER=UNFORMATTED MISSING;
TABLE
/* Row Dimension */
Group,
/* Column Dimension */
Amount*Sum;
;
RUN; QUIT;
I would get the output as:
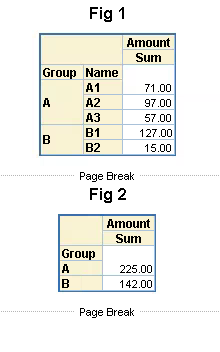
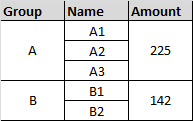
But, I actually want a combination of the above two proc tabulates as seen in the below image.
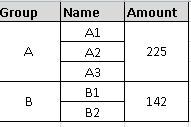
Background: I need to just see the sum of the sales in 'Amount' for the particular group and need to know which employess(Name) were responsible for these sales. I do not want the individual sales for each of the employees (Name) but still need to see who all contributed for the amount.
Another question: Can this be done in PROC REORT?
Thank you,
Shubha
- Mark as New
- Bookmark
- Subscribe
- Mute
- RSS Feed
- Permalink
- Report Inappropriate Content
Hi Moderators,
Sorry, I wanted to delete my messages which was appearing 5-6 times in this thread, but accidentally missed 'Ballardw''s response. Request you to please re-post ballardw's response in this thread. Thank you.
Regards,
Shubha

- Mark as New
- Bookmark
- Subscribe
- Mute
- RSS Feed
- Permalink
- Report Inappropriate Content
ballardw replied (in response to Fareeza Khurshed)
Excel sheets can have blanks that aren't seen unless you highlight the name like preparing to rename. And even then depending on the font may not be noticeable. I was suspecting long names which is why I asked earlier.
- Mark as New
- Bookmark
- Subscribe
- Mute
- RSS Feed
- Permalink
- Report Inappropriate Content
Is this the one you meant?
Note that this approach will only work for RTF as it creates a single text variable with the names concatenated (and hopefully one once per name, changing names May make the conditional part fail). Since this requires a pass through the data I accumulated a total at the same time. More complex statistics you may want to generate with proc means/summary with group as a class variable and merge to the names. The starting data needs to be sorted by group and name first.
Proc print is used to display the output to get the headers as desired which tabulate won't do. Proc Report might work with a list style report but I don't use that procedure much.
data have;
input Group $ Name $ Amount;
cards;
A A1 45
A A1 26
A A2 35
A A2 62
A A3 57
B B1 23
B B1 14
B B1 25
B B1 65
B B2 15
;
run;
ods escapechar='^';
/* /par is a paragraph character in RTF*/
/* make sure your input data set is sorted by group and name*/
data want;
set have;
by group;
length names $ 300; /* this needs to be at least as large as the total number of characters in
all of the names + 12*(largest number of names -1)*/
retain names '' tot .;
if first.group then do;
names="";
tot=.;
end;
/* string ^R/rtf'\par' basically says to put a paragraph marker in RTF output, this is pretty
fragile so be very careful adding things*/
if indexw(names,strip(name),'\ ') = 0 then names = catx("^R/rtf'\par' ",Names,name);
tot = sum(tot,amount);
if last.group then output;
run;
/* put your output file name below*/
ods rtf file='D:\data\junk.rtf'
style=meadow;
ods escapechar='^';
proc print data=want noobs label;
var group / style=[verticalalign=c];
var names / ;
var tot /style=[verticalalign=c];
label names='Names' tot='Total';
run;
ods rtf close;
- Mark as New
- Bookmark
- Subscribe
- Mute
- RSS Feed
- Permalink
- Report Inappropriate Content
Yes, that's very kind of you. Thank you very much.
I wanted this for an HTML report which is existing for months now.
I will try and get back if I have questions.
Regards,
Shubha
- Mark as New
- Bookmark
- Subscribe
- Mute
- RSS Feed
- Permalink
- Report Inappropriate Content
What I did was to create a table in Word and save as RTF and look for the raw codes. A similar approach may work for HTML to find the codes in the table. Maybe. I don't do much HTML customization as we need to have pages in my organization.
- Mark as New
- Bookmark
- Subscribe
- Mute
- RSS Feed
- Permalink
- Report Inappropriate Content
This exactly worked for my report. I went with "^R/html'</BR>' " for the html report. New learning!
Thanks very much.
Regards,
Shubha

- Mark as New
- Bookmark
- Subscribe
- Mute
- RSS Feed
- Permalink
- Report Inappropriate Content
If your output destination is HTML , then you can get it by modifying HTML source code .
.jpg")
Catch up on SAS Innovate 2026
Nearly 200 sessions are now available on demand in the Innovate Hub.
Watch Now →Learn how use the CAT functions in SAS to join values from multiple variables into a single value.

Find more tutorials on the SAS Users YouTube channel.
SAS Training: Just a Click Away
Ready to level-up your skills? Choose your own adventure.
-
11 replies
-
07-20-2015 12:27 PM
-
5930 views
-
0 likes
-
5 in conversation
-
