- Home
- /
- Programming
- /
- ODS Reports
- /
- Proc Report : highlighting a cell on each row
- RSS Feed
- Mark Topic as New
- Mark Topic as Read
- Float this Topic for Current User
- Bookmark
- Subscribe
- Mute
- Printer Friendly Page

- Mark as New
- Bookmark
- Subscribe
- Mute
- RSS Feed
- Permalink
- Report Inappropriate Content
Hi All,
I would like to underline the highest value on each row of a report, as in this simple example :
data test;
input grp across $ value @@;
datalines;
1 a 1.1 1 b 1.3 1 c 1.2
2 a 2.1 2 b 2.3 2 c 2.2
3 a 3.1 3 b 3.2 3 c 3.3
;
ods rtf file="&sasforum.\reports\abcTable.rtf" style=journal;
proc report data=test nowd;
column grp across,value;
define grp / group;
define across / "" across;
define value / "" mean;
run;
ods rtf close;
I would like a result like:
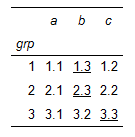
Thanks.
PG
Accepted Solutions

- Mark as New
- Bookmark
- Subscribe
- Mute
- RSS Feed
- Permalink
- Report Inappropriate Content
Hi PGStats
One can use arrays in a compute block. You can also change the sequence of across and analysis vars to make the headers look nicer See sample code below:
input grp across $ value @@;
datalines;
1 a 1.1 1 b 1.3 1 c 1.2
2 a 2.1 2 b 2.3 2 c 2.2
3 a 3.1 3 b 3.2 3 c 3.3
;
proc report data=test nowd;
column grp value, across _dummy;
define grp / group;
define across / "" across;
define value / "" mean;
define _dummy / computed /* noprint */;
compute _dummy;
* define array for across values;
array _xacross{*} _c2_ _c3_ _c4_;
acrossOffset = 1;
maxRowValue = max(OF _xacross{*});
* for checking;
_dummy = maxRowValue;
* find the colum equal to max ;
do i = 1 to dim(_xacross);
if _xacross{i} = maxRowValue then do;
call define(cats("_C", i + acrossOffset, "_"), "STYLE", "style={textdecoration=underline}");
end;
end;
endcomp;
run;
Bruno
- Mark as New
- Bookmark
- Subscribe
- Mute
- RSS Feed
- Permalink
- Report Inappropriate Content
Thanks a lot Bruno! You made my day! - PG
.jpg")
Catch up on SAS Innovate 2026
Nearly 200 sessions are now available on demand with the SAS Innovate Digital Pass.
Explore Now →Learn how use the CAT functions in SAS to join values from multiple variables into a single value.

Find more tutorials on the SAS Users YouTube channel.
SAS Training: Just a Click Away
Ready to level-up your skills? Choose your own adventure.
-
2 replies
-
10-30-2013 10:56 PM
-
2863 views
-
3 likes
-
2 in conversation
-
