- Home
- /
- Programming
- /
- ODS Reports
- /
- Proc Report - Analysis in Rows?
- RSS Feed
- Mark Topic as New
- Mark Topic as Read
- Float this Topic for Current User
- Bookmark
- Subscribe
- Mute
- Printer Friendly Page

- Mark as New
- Bookmark
- Subscribe
- Mute
- RSS Feed
- Permalink
- Report Inappropriate Content
Trying to get my sums in rows instead of columns, under an across, while using Proc Report (for formatting flexibility).
| Group1 | Group2 | Statistic | Across1 | Across2 | Across3 |
|---|---|---|---|---|---|
| NY | Upstate | Sum of X | 10 | 20 | 15 |
| Sum of Y | 4 | 5 | 6 | ||
| Downstate | Sum of X | 8 | 9 | 10 | |
| Sum of Y | 1 | 2 | 3 | ||
| PA | Philadelphia | ETC.... |
If the code were tabulate, it'd look something like this:
proc tabulate data = sashelp.cars;
class make model type;
var msrp invoice;
table (make='')*(model='')*
(msrp='Sum MSRP' *sum=''
invoice='Sum Invoice' *sum=''),
(type='')/
box='' row=float;
run;

- Mark as New
- Bookmark
- Subscribe
- Mute
- RSS Feed
- Permalink
- Report Inappropriate Content
Hi:
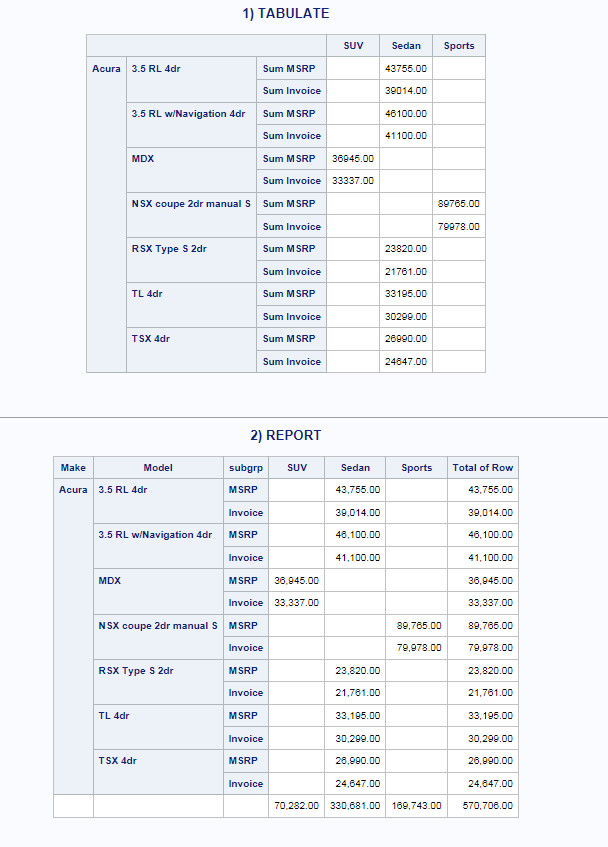
Proc REPORT doesn't do "stacking" in the ROW dimension like PROC TABULATE allows in its syntax. But, you CAN generate a report like you want. But you will need to "flip" the data around a bit. As a teaser, here's an example comparing TABULATE output from your code with REPORT (using only Acura to fit in one screen):
Here's the code. I made a "helper" variable called SUBGRP in a DATA step program so that there would be a SUBGRP column on the report.
Cynthia
ods html file='c:\temp\flip_it.html';
proc tabulate data = sashelp.cars;
where make = 'Acura' ;
title '1) TABULATE';
class make model type;
var msrp invoice;
table (make='')*(model='')*
(msrp='Sum MSRP' *sum='' invoice='Sum Invoice' *sum=''),
(type='')/
box='' row=float;
run;
data flip_it;
set sashelp.cars;
length subgrp $10;
where make = 'Acura' ;
subgrp = 'MSRP';
val = msrp;
output;
subgrp = 'Invoice';
val = invoice;
output;
run;
options missing=' ';
proc report data=flip_it nowd spanrows;
title '2) REPORT';
column make model subgrp val,type val=vtot;
define make / group style(column)=Header;
define model / group style(column)=Header;
define subgrp / group order=data style(column)=Header;
define type / across ' ';
define val / sum f=comma10.2 ' ';
define vtot / sum 'Total of Row' f=comma10.2;
rbreak after / summarize;
run;
ods html close;
- Mark as New
- Bookmark
- Subscribe
- Mute
- RSS Feed
- Permalink
- Report Inappropriate Content
Nice to see you again, Cynthia.
I suspected this would be the case, I was just hoping to avoid it. I'll either set this up or figure out a compromise with Tabulate or something.
Thanks.
Wes
- Mark as New
- Bookmark
- Subscribe
- Mute
- RSS Feed
- Permalink
- Report Inappropriate Content
Any thoughts on how to highlight the Sports column say with a yellow background or with bold font? I'm having trouble getting the format to carry through the whole column and not just highlight the header.
proc format;
value $light
'Sports' = yellow
other = white;
run;
proc tabulate data = sashelp.cars;
where make = 'Acura';
class make model type;
classlev type/style=[background = $light.];
var msrp invoice;
table (make='')*(model='')*
(msrp='Sum MSRP' *sum=''
invoice='Sum Invoice' *sum=''),
(type='')/
box='' row=float;
run;

- Mark as New
- Bookmark
- Subscribe
- Mute
- RSS Feed
- Permalink
- Report Inappropriate Content
25102 - Applying the same style across a row in the TABULATE procedure has an example. Or http://support.sas.com/resources/papers/proceedings13/366-2013.pdf
You can add the Parent to VAR variables and statistics as well. You may need to set STYLE_PRECEDENCE=Row as well.
- Mark as New
- Bookmark
- Subscribe
- Mute
- RSS Feed
- Permalink
- Report Inappropriate Content
Coloring by row seems to be easy, but I cannot find a single example anywhere of the column coloring the data.
- Mark as New
- Bookmark
- Subscribe
- Mute
- RSS Feed
- Permalink
- Report Inappropriate Content
Page 18 here describes a solution. However it dictates that the header style must always be carried. I don't see a way to selectively carry the header attributes.
- Mark as New
- Bookmark
- Subscribe
- Mute
- RSS Feed
- Permalink
- Report Inappropriate Content
I think it is time to more clearly describe your data and SHOW what you want the output to look like. Generate the html (or RTF) output without style overrides and then edit it to look as desired and post that. I think we're guessing as to what you want.
- Mark as New
- Bookmark
- Subscribe
- Mute
- RSS Feed
- Permalink
- Report Inappropriate Content
There's not actually an option for me to attach a file. So the "no style" output below has columns first\second\third. The header background is beige and the data background is white. In the second, styled output, the column third is all green, but the first\second columns' data background also carries the header background - they fill beige instead of remaining white.
ods tagsets.excelxp
file= "test.xml"
style=normal
options (SHEET_INTERVAL="none");
title 'no styles';
proc tabulate data = test;
class name category;
var val;
table name=' ',category=' '*val=' ';
keylabel sum=' ';
run;
proc format;
value $cat
/*'first'=yellow*/
/*'second'=red*/
'third'=green;
run;
title 'Green is styled intentionally, but first\second are unintentionally';
proc tabulate data=test;
class name category;
classlev category / s=[background=$cat.];
var val / style=<parent>;
keyword sum / style=<parent>;
keylabel sum=' ';
table name=' ',category=' '*val=' '*
{style=<parent> {foreground=black}};
run;
ods tagsets.excelxp close;
.jpg")
Catch up on SAS Innovate 2026
Nearly 200 sessions are now available on demand with the SAS Innovate Digital Pass.
Explore Now →Learn how use the CAT functions in SAS to join values from multiple variables into a single value.

Find more tutorials on the SAS Users YouTube channel.
SAS Training: Just a Click Away
Ready to level-up your skills? Choose your own adventure.
-
8 replies
-
03-18-2015 10:24 AM
-
4659 views
-
3 likes
-
3 in conversation
-
