- Home
- /
- Programming
- /
- ODS Reports
- /
- Is it possible to delete few empty lines after proc report?
- RSS Feed
- Mark Topic as New
- Mark Topic as Read
- Float this Topic for Current User
- Bookmark
- Subscribe
- Mute
- Printer Friendly Page

- Mark as New
- Bookmark
- Subscribe
- Mute
- RSS Feed
- Permalink
- Report Inappropriate Content
Hi,
Proc report has a few options that control sizes of records heigh , width, sizes of lines after breaks, groups etc.
But I have a little bit different task related with report layout - few different proc reports that should be printed after each other, but interval between them should be very small(almost invisible for developers with huge experience![]() ).
).
So question is if it possible eliminate these empty lines after each of proc report(odsdest=html).
Reports can be very different so make some one proc report for all of them isn't solution...
Thanks!
Accepted Solutions

- Mark as New
- Bookmark
- Subscribe
- Mute
- RSS Feed
- Permalink
- Report Inappropriate Content
Hi:
The issue is that you have 4 separate tables, each with their own HTML TABLE tags, TD tags, TBODY tags and THEAD tags. And, whether you use ODS HTML or ODS CSV or ODS TAGSETS.EXCELXP, the problem is that you are still generating 4 separate tables. You can disappear the horizontal rule between all 4 tables (using STYLE=NORMAL or STYLE=SEASIDE, for example), but you can't just take 1 separate table with 5 separate columns and make it be part of a completely separate table with 3 separate columns. When ODS constructs output, it wants each table to have the same number of columns on every row.
In my mind, this is not just an issue of removing a little extra white space and the horizontal rule. The issue, for me, is that you want to take 2 differently structured tables and leave the column headers intact and make the 2 tables look like 1 table. And then you want to do the same thing again for 2 differently structured tables.
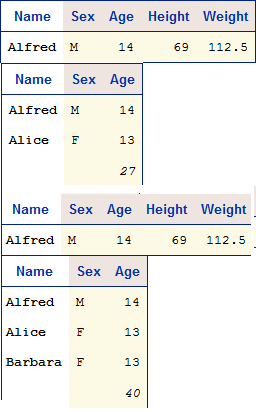
And, even if you could get this working by manually constructing your own HTML or by post-processing the HTML that was created by SAS, there is no guarantee that the HTML would translate well in other client applications as a stored process. For example, I can manually construct HTML tags to generate the type of table that you want. However, that defeats the purpose of using ODS -- and, even if you get the output looking close to how you want in a browser (see attached screenshot on left), when the HTML file is opened in Excel, you can see that Excel does what it wants to do with the HTML and all the formatting that kept the tables separate is lost (in right side of screen shot).
There is a remote chance that ODS LAYOUT and the new DATA step reporting interface might work for you in this instance. However, I'm not sure that the new stuff will work in the context of a stored process, even if you could get it working for "regular" ODS. That would be a question for Tech Support. The only alternative that I can think of would be for you to construct your own HTML and/or post-process the HTML created by ODS --and again, knowing that you want to use this in a stored process and knowing that not all client applications use HTML tags the same way (or at all), this seems to me a LOT of effort for a possibly less than desired outcome.
To me, it looks like you have some kind of grand total or summary line that occurs before your detail lines on the report. PROC REPORT would do this for you with a BREAK BEFORE or an RBREAK BEFORE. So now, I think, it comes down to what your data will really look like and what the real purpose is for the cosmetics and whether there's anyway to achieve the goal with less rigid cosmetic requirements.
cynthia


- Mark as New
- Bookmark
- Subscribe
- Mute
- RSS Feed
- Permalink
- Report Inappropriate Content
It would help if you provide the code you are using, but modified to use sashelp.class as the dataset(s).
That way, you may not have to wait until after the US holiday to get an answer.
- Mark as New
- Bookmark
- Subscribe
- Mute
- RSS Feed
- Permalink
- Report Inappropriate Content
Hi:
Many of the PROC REPORT options, such as width, space, underline, overline, flow, headline, headskip, skip, etc are LISTING only options. Since you indicate that you want HTML output, those LISTING options will be ignored. When you use ODS HTML and most styles, if you have 2 PROC REPORT steps, one after the other, normally, ODS HTML puts a horizontal rule between each table.
The short answer to your question is that it is difficult to control the amount of space between tables but someone would have to see your real code and the types of PROC REPORTS that you have and the options/style that you specify in order to really see whether there's any help that can be offered.
Since you referred to odsdest=html, I wonder whether you are working with stored processes. If so, keep in mind that not all destinations in the BI Platform use HTML output. Some client applications, like Web Report Studio and PowerPoint only use SASReport XML as the default report type and it is possible that some techniques, such as using a different style or a custom style might not work for all client applications.
But, as Art recommended, it would be useful to see actual code.
cynthia
- Mark as New
- Bookmark
- Subscribe
- Mute
- RSS Feed
- Permalink
- Report Inappropriate Content
Cynthia: You're supposed to be enjoying Thanksgiving! We had ours, in Canada, last month.
- Mark as New
- Bookmark
- Subscribe
- Mute
- RSS Feed
- Permalink
- Report Inappropriate Content
I did have a lovely Thanksgiving, but really, you can only watch so many sports shows (and have wine with dinner!) without sneaking a peek at a few web sites! 😉
cynthia
- Mark as New
- Bookmark
- Subscribe
- Mute
- RSS Feed
- Permalink
- Report Inappropriate Content
Hi Cynthia and art297,
So first of all here is test code that forms 4 test reports that approximate describe the problem:
proc sql inobs=1;
Create table tab1 as
select *
from sashelp.class
;
quit;
proc sql inobs=2;
Create table tab2 as
select name,sex,age
from sashelp.class
;
quit;
proc sql inobs=1;
Create table tab3 as
select *
from sashelp.class
;
quit;
proc sql inobs=3;
Create table tab4 as
select name,sex,age
from sashelp.class
;
quit;
proc report data=tab1 nocenter;
define name/style=[font_weight=bold background=white] order;
run;
proc report data=tab2 nocenter;
define name/style=[font_weight=bold background=white];
rbreak after/summarize;
run;
proc report data=tab3 nocenter;
define name/style=[font_weight=bold background=white];
run;
proc report data=tab4 nocenter;
define name/style=[font_weight=bold background=white];
rbreak after/summarize;
run;
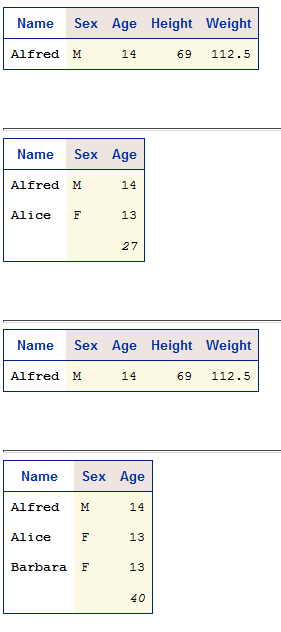
Here is results:
Cynthia was right, I need these reports first in STP(stored process), and in next task will be export these reports to excel, but it's next task, I know that for ods excel proc report options are not active, but for now I should make "nice" view of these reports in Stored process application.
Regarding reports, what I want to implement:
Two first reports have different columns names, diff. column count, types etc., but they should be connected as it is one repoort, after second report should be simple sum calculation, that is applied only for second report.
Then should be small break, and after this break next two reports should be conncected the same way as first two, these last two reports have same columns as first two, but can have different rows count.
So target report I see similar to this image:
I understand that such reports structure can be probably realized by one +-complicated proc report but the problem is that this reports will be changed very often, new subreports could be added to each of group etc, so I plan to create more flexible approach that will allow in loop build few simple proc report and merge them, so they look the same as one report.So if you have some ideas how to delete these few empty lines between reports- please let me know.
Thanks for your answer in adwanced:)!
- Mark as New
- Bookmark
- Subscribe
- Mute
- RSS Feed
- Permalink
- Report Inappropriate Content
Hi:
The issue is that you have 4 separate tables, each with their own HTML TABLE tags, TD tags, TBODY tags and THEAD tags. And, whether you use ODS HTML or ODS CSV or ODS TAGSETS.EXCELXP, the problem is that you are still generating 4 separate tables. You can disappear the horizontal rule between all 4 tables (using STYLE=NORMAL or STYLE=SEASIDE, for example), but you can't just take 1 separate table with 5 separate columns and make it be part of a completely separate table with 3 separate columns. When ODS constructs output, it wants each table to have the same number of columns on every row.
In my mind, this is not just an issue of removing a little extra white space and the horizontal rule. The issue, for me, is that you want to take 2 differently structured tables and leave the column headers intact and make the 2 tables look like 1 table. And then you want to do the same thing again for 2 differently structured tables.
And, even if you could get this working by manually constructing your own HTML or by post-processing the HTML that was created by SAS, there is no guarantee that the HTML would translate well in other client applications as a stored process. For example, I can manually construct HTML tags to generate the type of table that you want. However, that defeats the purpose of using ODS -- and, even if you get the output looking close to how you want in a browser (see attached screenshot on left), when the HTML file is opened in Excel, you can see that Excel does what it wants to do with the HTML and all the formatting that kept the tables separate is lost (in right side of screen shot).
There is a remote chance that ODS LAYOUT and the new DATA step reporting interface might work for you in this instance. However, I'm not sure that the new stuff will work in the context of a stored process, even if you could get it working for "regular" ODS. That would be a question for Tech Support. The only alternative that I can think of would be for you to construct your own HTML and/or post-process the HTML created by ODS --and again, knowing that you want to use this in a stored process and knowing that not all client applications use HTML tags the same way (or at all), this seems to me a LOT of effort for a possibly less than desired outcome.
To me, it looks like you have some kind of grand total or summary line that occurs before your detail lines on the report. PROC REPORT would do this for you with a BREAK BEFORE or an RBREAK BEFORE. So now, I think, it comes down to what your data will really look like and what the real purpose is for the cosmetics and whether there's anyway to achieve the goal with less rigid cosmetic requirements.
cynthia
- Mark as New
- Bookmark
- Subscribe
- Mute
- RSS Feed
- Permalink
- Report Inappropriate Content
Hi again Cinthia,
You are right , I also assumed that situations looks similar as you described , but I didn't want to belive in it becouse it means that I should merge this grids into one and then create proc report with diff flags that will separate them by diff colors/styles in order to achive view similar to needed...ehhh)))...
Ok,anyway thanks for help))).
- Mark as New
- Bookmark
- Subscribe
- Mute
- RSS Feed
- Permalink
- Report Inappropriate Content
Hi:
Getting the data into the right structure and doing the summarization is probably going to be a bigger hassle than the PROC REPORT code. As you can see from the attached program (using fake data), if all the variables are character variables and if the data are presummarized, then you can massage the data to have an order number variable and a type variable that will be used to determine the formatting of the rows.
However, as I warned previously, before you go too far down this road, I would make absolutely sure that the results are OK when the stored process results are surfaced in other client applications of the BI Platform. Because, if the results are not as you desire in ALL client applications, including Excel, WRS and PowerPoint, then there's probably no point in going to all the trouble.
cynthia
data fakedata;
infile datalines;
input ordnum type $ col1 $ col2 $ col3 $ col4 $ col5 $;
return;
datalines;
10 d alan M 11 72 100
20 h Name Sex Age . .
21 d alan M 11 . .
22 d barb F 12 . .
23 d carl M 13 . .
30 t . . 36 . .
;
run;
ods listing close;
options nocenter;
ods msoffice2k file='c:\temp\usefakedata.html' style=egdefault;
proc report data=fakedata nowd;
column ordnum type col1 col2 col3 col4 col5;
define ordnum / order noprint;
define type / display noprint;
define col1 / display 'Name'
style(header)=[font_weight=bold background=white];
define col2 / display 'Sex';
define col3 / display 'Age';
define col4 / display 'Height';
define col5 / display 'Weight';
compute col5;
if type = 'h' then do;
call define('col1','style','style=Header{background=white}');
call define('col2','style','style=Header');
call define('col3','style','style=Header');
call define('col4','style','style={background=white foreground=white}');
call define('col5','style','style={background=white foreground=white}');
end;
else if type = 'd' then do;
call define(_row_,'style','style=Data');
end;
else if type = 't' then do;
call define(_row_,'style','style=Data{font_weight=bold}');
end;
endcomp;
run;
ods msoffice2k close;
- Mark as New
- Bookmark
- Subscribe
- Mute
- RSS Feed
- Permalink
- Report Inappropriate Content
Hi Cinthia,
You are absolutely right with example of code that you provided, yestarday I have almost finished with similar code on real data, with only one difference - I also added summury row(that calcualtes sum of one of the column from second table in each group) with different flag(type in your example.).
I almost sure that I'll succeed in creating report view that is needed, but I am a little bit dissapointed that proc report in this case is using only for formatting one-table date:for separating rows with different types(header,data,sum row etc.), and also this data for report should be merged(calculated if it's sum row) before the proc report, so from performace side it can be a little bit inoptimal, but it's specific task so probably this solution can be the only one for it.
Thanks!
- Mark as New
- Bookmark
- Subscribe
- Mute
- RSS Feed
- Permalink
- Report Inappropriate Content
Hi:
Most SAS procedures (not just PROC REPORT) operate on the 1-table principal. It just is outside the territory of how SAS procedures operate to expect a procedure, especially a reporting procedure, to operate on more than 1 table at a time. PROC FREQ, PROC MEANS, PROC TABULATE, PROC REG, PROC PRINT, PROC REPORT -- they all operate on just 1 table at a time. If you need to run the same procedure on a different dataset, you get the opportunity for new titles, new footnotes, new variables -- different dataset, different report table. Once one table has been created and sent to a destination, the procedure and ODS are done with that table, there's no going back or "adding to" that table once it has been created.
On the other hand, the new (still pre-production) DATA step reporting interface, gives you the full capability of the DATA step -- in a DATA step, you could have 1 or more than 1 SET statements -- you can read multiple datasets with a DATA step program, you do have conditional logic and with the new object-oriented interface, you can control how and where to write objects, such as report tables, headers, images, etc. If you investigate the information at this site and look at the papers, you may be able to get an idea of how this new object-oriented syntax is going to work and whether it is more to you liking.
http://support.sas.com/rnd/base/datastep/dsobject/index.html
cynthia
- Mark as New
- Bookmark
- Subscribe
- Mute
- RSS Feed
- Permalink
- Report Inappropriate Content
Hi Cinthia,
I'll investigare this new data step reporting interface, thanks!
.jpg")
Catch up on SAS Innovate 2026
Nearly 200 sessions are now available on demand with the SAS Innovate Digital Pass.
Explore Now →Learn how use the CAT functions in SAS to join values from multiple variables into a single value.

Find more tutorials on the SAS Users YouTube channel.
SAS Training: Just a Click Away
Ready to level-up your skills? Choose your own adventure.
-
11 replies
-
11-24-2011 12:04 PM
-
9347 views
-
1 like
-
3 in conversation
-
