- Home
- /
- Programming
- /
- ODS Reports
- /
- GTL changing label of tickvalues
- RSS Feed
- Mark Topic as New
- Mark Topic as Read
- Float this Topic for Current User
- Bookmark
- Subscribe
- Mute
- Printer Friendly Page


- Mark as New
- Bookmark
- Subscribe
- Mute
- RSS Feed
- Permalink
- Report Inappropriate Content
Hello,
i want to change the labels of the tickvalues, and i couldn't find a solution how to do that. I think somehow in the following part i need to change something to change the labels.
layout overlay / xaxisopts=(display=none) walldisplay=none yaxisopts=(display=(tickvalues) tickvalueattrs=(size=8)) ;
                              scatterplot x=tatrisk y=stratum / group=stratum  markercharacter=atrisk markercharacterattrs=(size=8);
                         endlayout;
The Result i get in my graph is following:
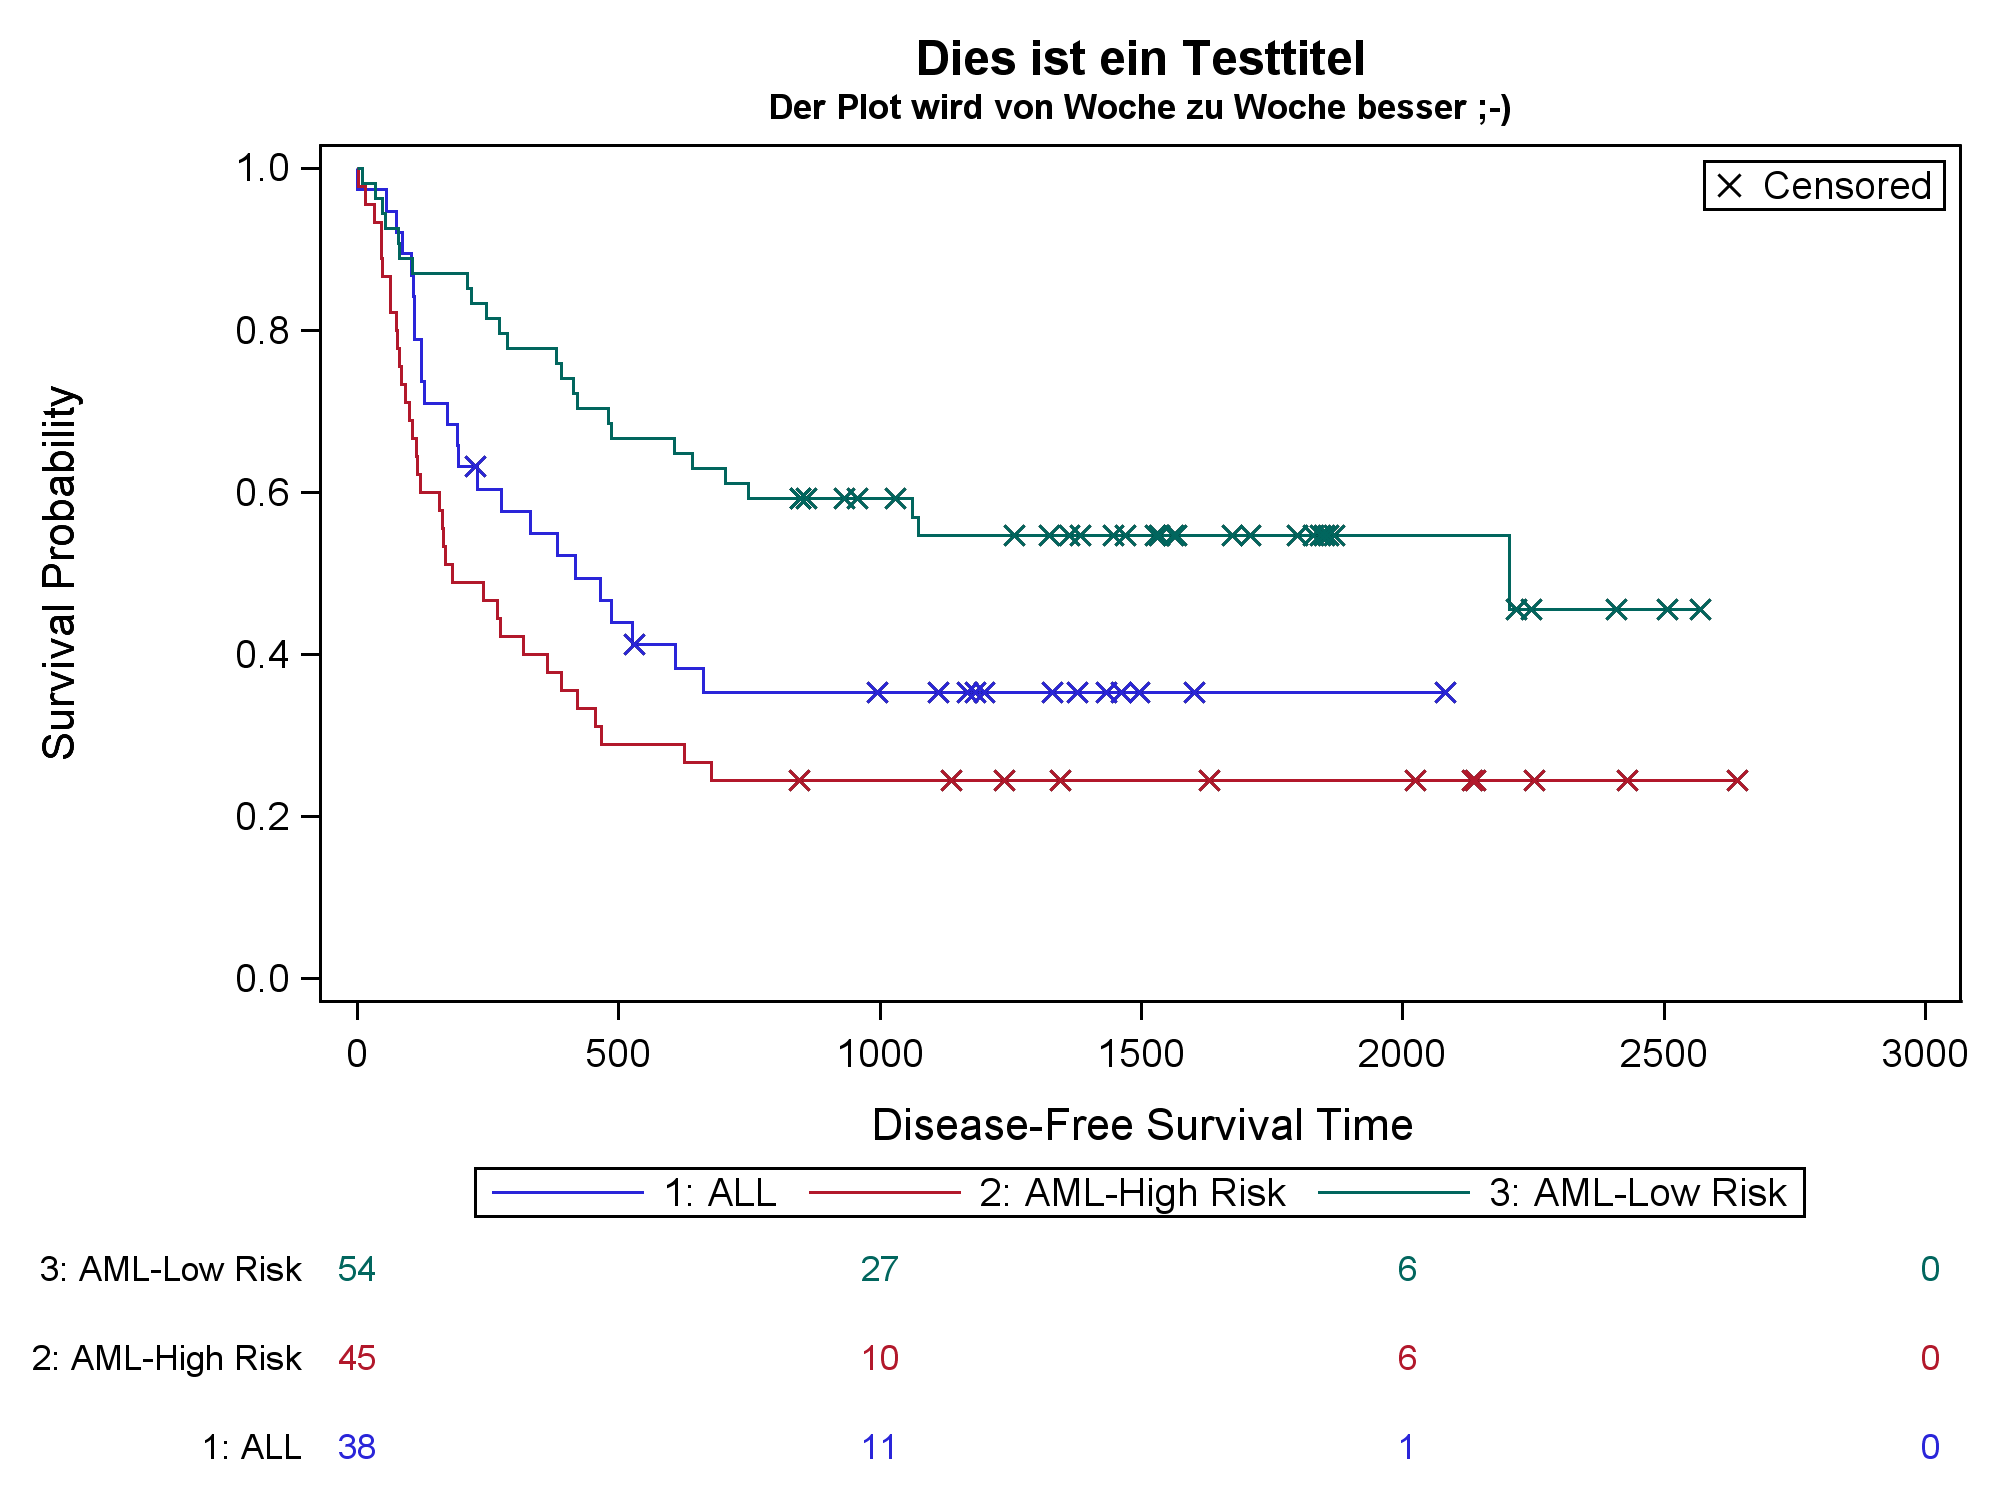
As you can see in the Risktable, the Labels are "3: AML-Low Risk", "2: AML-High Risk", ... i want to change them in "AML-Low Risk", "AML-High-Risk" and so on....
When i put the same risk table with a blockblot statement inside the graph, i can just make this:
blockplot x=tatrisk&i. block=AtRisk&i. / display=(values label) valuehalign=start valueattrs=Graphdata&i. (size=8) labelattrs=(size=8);with display=(values label) i get the desired result (the labes i changed before...
But how can i solve this problem with the "overlay solution"???
Maybe you can help me.
Tahanks in advance!
Accepted Solutions


- Mark as New
- Bookmark
- Subscribe
- Mute
- RSS Feed
- Permalink
- Report Inappropriate Content
Sorry i doubt if the above solution will work, if not could you please try the below one create a new variable related to stratum. at the momnet i believe the variable stratum has the values as "3: AML-Low Risk", "2: AML-High Risk"...... so create a new variable related to stratum but has values as "AML-Low Risk", "AML-High Risk"...... then use the class=new variable on the BlockPlot statement. This will disply the label as per the values that are present in the newvariable.
blockplot x=tatrisk&i.  block=AtRisk&i.  /  display=(values label) valuehalign=start valueattrs=Graphdata&i. (size=8) labelattrs=(size=8)
class=newvariable;
Jag
- Mark as New
- Bookmark
- Subscribe
- Mute
- RSS Feed
- Permalink
- Report Inappropriate Content
The way we could change the label of the block plot is to change the variabe values in the atrisk&i, i believe at the moment the atrisk&i is resolving to "3: AML-Low Risk", "2: AML-High Risk" please change those labels to "AML-Low Risk", "AML-High Risk"...... and may be you could see the difference.
Jag
- Mark as New
- Bookmark
- Subscribe
- Mute
- RSS Feed
- Permalink
- Report Inappropriate Content
Sorry i doubt if the above solution will work, if not could you please try the below one create a new variable related to stratum. at the momnet i believe the variable stratum has the values as "3: AML-Low Risk", "2: AML-High Risk"...... so create a new variable related to stratum but has values as "AML-Low Risk", "AML-High Risk"...... then use the class=new variable on the BlockPlot statement. This will disply the label as per the values that are present in the newvariable.
blockplot x=tatrisk&i.  block=AtRisk&i.  /  display=(values label) valuehalign=start valueattrs=Graphdata&i. (size=8) labelattrs=(size=8)
class=newvariable;
Jag
- Mark as New
- Bookmark
- Subscribe
- Mute
- RSS Feed
- Permalink
- Report Inappropriate Content
That really was the easiest way to solve the problem. Maybe this solution could costs some runtime when handling very big datasets, but for my case it's brilliant!
Thank you very much!

Catch up on SAS Innovate 2026
Nearly 200 sessions are now available on demand with the SAS Innovate Digital Pass.
Explore Now →Learn how use the CAT functions in SAS to join values from multiple variables into a single value.

Find more tutorials on the SAS Users YouTube channel.
SAS Training: Just a Click Away
Ready to level-up your skills? Choose your own adventure.
-
3 replies
-
11-11-2015 05:11 AM
-
2589 views
-
1 like
-
2 in conversation
-


