- Home
- /
- Programming
- /
- Graphics
- /
- vbar multiple analysis vars
- RSS Feed
- Mark Topic as New
- Mark Topic as Read
- Float this Topic for Current User
- Bookmark
- Subscribe
- Mute
- Printer Friendly Page

- Mark as New
- Bookmark
- Subscribe
- Mute
- RSS Feed
- Permalink
- Report Inappropriate Content
hi, i thought this would be easy but i cannot find a way to do it (in a simple way in sas913).
i want to create a bar chart with multiple analysis vars, like the chart below i created in excel:
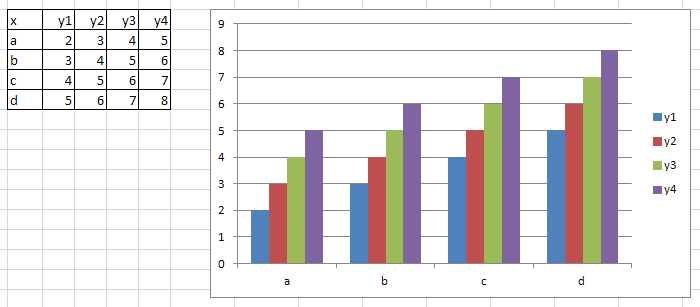
how can i do this in sas?
thanks, Bart

- Mark as New
- Bookmark
- Subscribe
- Mute
- RSS Feed
- Permalink
- Report Inappropriate Content
SAS graph is definitely NOT my forte, but the following gets a fairly close result to what you want:
data have;
input x $ y1-y4;
cards;
a 2 3 4 5
b 3 4 5 6
c 4 5 6 7
d 5 6 7 8
;
data need (keep=x time y);
set have;
array thedata(*) y1-y4;
do time=1 to dim(thedata);
y=thedata(time);
output;
end;
run;
proc gchart data=need;
vbar y / discrete
type=sum sumvar=y
group=x
space=0
gspace=4
subgroup=time /* this controls the coloring */
maxis=axis1 /* midpoint axis */
raxis=axis2 /* response/numeric axis */
gaxis=axis3 /* group axis */
autoref /* reflines at every major axis tickmark */
clipref /* put reflines behind the bars */
cref=graycc
legend=legend1
coutline=black
des=""
;
run;
quit;
- Mark as New
- Bookmark
- Subscribe
- Mute
- RSS Feed
- Permalink
- Report Inappropriate Content
thanks i will give this a go.

- Mark as New
- Bookmark
- Subscribe
- Mute
- RSS Feed
- Permalink
- Report Inappropriate Content
Using Art's data, reshape the data by groups and use proc GCHART.
data group;
keep x grp val;
set have;
grp='Y1'; val=y1; output;
grp='Y2'; val=y2; output;
grp='Y3'; val=y3; output;
grp='Y4'; val=y4; output;
run;
proc gchart data=group;
vbar grp / sumvar=val group=x subgroup=grp autoref clipref;
run;
quit;

- Mark as New
- Bookmark
- Subscribe
- Mute
- RSS Feed
- Permalink
- Report Inappropriate Content
And one more variation ...
data my_data;
input groupvar $ y1-y4;
cards;
a 2 3 4 5
b 3 4 5 6
c 4 5 6 7
d 5 6 7 8
;
run;
proc transpose data=my_data out=tran_data;
by groupvar;
run;
data tran_data; set tran_data (rename=(col1=value _name_=category));
label category='Category';
run;
legend1 label=none across=1 position=(right middle) shape=bar(.15in,.15in)
offset=(-10,0);
axis1 label=none minor=none order=(0 to 9 by 1);
axis2 label=none value=none;
axis3 label=none;
pattern1 v=s c=cx4f81bd;
pattern2 v=s c=cxc0504d;
pattern3 v=s c=cx9bbb59;
pattern4 v=s c=cx8064a2;
proc gchart data=tran_data;
vbar category / type=sum sumvar=value
group=groupvar
subgroup=category
space=0
legend=legend1
raxis=axis1
maxis=axis2
gaxis=axis3
noframe
autoref cref=graydd clipref
coutline=same
;
run;
.jpg")
Catch up on SAS Innovate 2026
Nearly 200 sessions are now available on demand in the Innovate Hub.
Watch Now →Learn how use the CAT functions in SAS to join values from multiple variables into a single value.

Find more tutorials on the SAS Users YouTube channel.
SAS Training: Just a Click Away
Ready to level-up your skills? Choose your own adventure.
-
4 replies
-
08-05-2012 12:57 PM
-
2699 views
-
3 likes
-
4 in conversation
-
