- Home
- /
- Programming
- /
- Graphics
- /
- stacked bar chart: change order of bars (not of colors in bars)
- RSS Feed
- Mark Topic as New
- Mark Topic as Read
- Float this Topic for Current User
- Bookmark
- Subscribe
- Mute
- Printer Friendly Page

- Mark as New
- Bookmark
- Subscribe
- Mute
- RSS Feed
- Permalink
- Report Inappropriate Content
I created a stacked bar chart with sgplot. I would like to change the order of the bars but I can only find how to change the order of the colors within the bars.
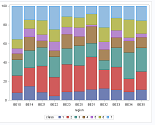
Each bar represents a region. The regions are ordered alphabetically: BE10 BE14 BE21 BE22 BE23...
I want to change this order, for example into BE22 BE10 BE21 BE23 BE25 BE34 BE31 BE33 BE35 BE32 BE14.
I can not find how to do this.
There are options like grouporder and categoryorder. But they change the order of the colors of the classes within a region but not the order of the regions.
I also tried with proc gchart but even there I could not find it. Midpoint= or order= were not working.
Many thanks!
my code:
data barchart;
input region $ class weight;
datalines;
BE22 1 4.6357615894
BE10 1 8.0536912752
BE21 1 8.59375
BE34 1 8.7719298246
BE23 1 8.9622641509
BE25 1 9.375
BE33 1 10.869565217
BE35 1 11.392405063
BE31 1 11.475409836
BE32 1 12.658227848
BE14 1 15.094339623
BE34 2 14.035087719
BE10 2 18.120805369
BE35 2 18.987341772
BE14 2 19.496855346
BE32 2 19.831223629
BE22 2 19.867549669
BE33 2 24.456521739
BE25 2 27.678571429
BE21 2 27.734375
BE23 2 29.245283019
BE31 2 34.426229508
BE32 3 10.126582278
BE31 3 14.754098361
BE10 3 16.77852349
BE23 3 16.981132075
BE14 3 18.238993711
BE21 3 19.921875
BE33 3 20.652173913
BE25 3 20.982142857
BE22 3 21.854304636
BE35 3 25.316455696
BE34 3 28.070175439
BE22 4 6.6225165563
BE10 4 6.711409396
BE21 4 7.03125
BE25 4 9.8214285714
BE33 4 10.869565217
BE32 4 11.392405063
BE35 4 11.392405063
BE34 4 12.280701754
BE14 4 14.465408805
BE23 4 15.094339623
BE31 4 18.032786885
BE31 5 1.6393442623
BE34 5 3.5087719298
BE35 5 3.7974683544
BE10 5 5.3691275168
BE21 5 6.640625
BE23 5 7.5471698113
BE33 5 7.6086956522
BE32 5 8.0168776371
BE14 5 8.8050314465
BE22 5 9.2715231788
BE25 5 9.375
BE14 6 9.4339622642
BE10 6 10.067114094
BE25 6 10.714285714
BE23 6 11.320754717
BE31 6 11.475409836
BE33 6 13.043478261
BE22 6 13.245033113
BE35 6 13.924050633
BE21 6 15.234375
BE32 6 15.611814346
BE34 6 19.298245614
BE31 7 8.1967213115
BE23 7 10.849056604
BE25 7 12.053571429
BE33 7 12.5
BE34 7 14.035087719
BE14 7 14.465408805
BE21 7 14.84375
BE35 7 15.189873418
BE32 7 22.362869198
BE22 7 24.503311258
BE10 7 34.899328859
;
run;
goptions reset=all hsize=20cm;
options dev=actximg printerpath=png nodate nonumber;
ods printer file="I:\Brol\test.png";
proc sgplot data=barchart;
vbar region / response=weight group=class ; run;
ods printer close;
Accepted Solutions

- Mark as New
- Bookmark
- Subscribe
- Mute
- RSS Feed
- Permalink
- Report Inappropriate Content
Hi, you could apply a format to a derivation of the region variable so that it is displayed in the order you want.
For example, create another dataset that has region order you want.
data mydata2;
set mydata;
if region = "BE22" then regionn = 1;
else if region = "BE10" then regionn = 2;
....
run;
Create a format based on regionn, such as;
proc format;
value order 1 = "BE22"
2 = "BE10"
...
;
run;
Finally use regionn and the format order. in your sgplot code.
.jpg")
Catch up on SAS Innovate 2026
Nearly 200 sessions are now available on demand in the Innovate Hub.
Watch Now →Learn how use the CAT functions in SAS to join values from multiple variables into a single value.

Find more tutorials on the SAS Users YouTube channel.
SAS Training: Just a Click Away
Ready to level-up your skills? Choose your own adventure.
-
1 reply
-
07-30-2015 04:27 AM
-
4239 views
-
0 likes
-
2 in conversation
-
