- Home
- /
- Programming
- /
- Graphics
- /
- proc gmap
- RSS Feed
- Mark Topic as New
- Mark Topic as Read
- Float this Topic for Current User
- Bookmark
- Subscribe
- Mute
- Printer Friendly Page

- Mark as New
- Bookmark
- Subscribe
- Mute
- RSS Feed
- Permalink
- Report Inappropriate Content
Using proc gmap, how do I should clusters if I only have 1 zip code assigned to each data point?
For example, for zip code 99999, I have n=5 data points. This meaning I would like to show 5 dots clustered in the 99999 zip code area. Right now my code only gives me 1 dot per zip code.
Thanks!

- Mark as New
- Bookmark
- Subscribe
- Mute
- RSS Feed
- Permalink
- Report Inappropriate Content
You will probably find Darrell's "dot density" map useful ...
https://support.sas.com/rnd/papers/sugi29/sasmapping2.pdf

- Mark as New
- Bookmark
- Subscribe
- Mute
- RSS Feed
- Permalink
- Report Inappropriate Content
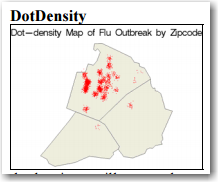
Are you using Annotate? I assume so if you are showing dots. The same ZIP Code will show up on exactly on top of each other, so you will see only one dot. You can use a dot-density map. You scatter the dot slightly so you will see all the dots.
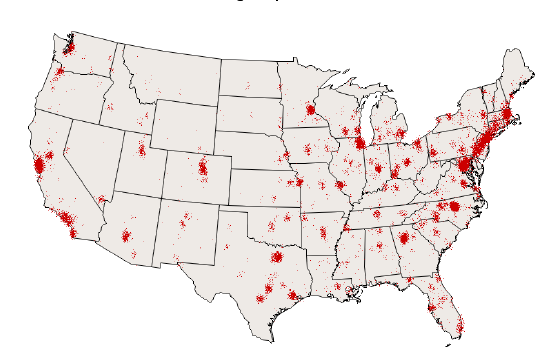
This is in several SGF/SUGI papers. Look in http://support.sas.com/rnd/papers/#SGF2011.
Look for the paper: Outbreak Maps: Visually Discovering Your Data.
The link to the examples zipfile is under it. Look for density.sas and shift.sas.
.jpg")
Catch up on SAS Innovate 2026
Nearly 200 sessions are now available on demand in the Innovate Hub.
Watch Now →Learn how use the CAT functions in SAS to join values from multiple variables into a single value.

Find more tutorials on the SAS Users YouTube channel.
SAS Training: Just a Click Away
Ready to level-up your skills? Choose your own adventure.
-
2 replies
-
03-27-2015 09:03 AM
-
2601 views
-
0 likes
-
3 in conversation
-
