- Home
- /
- Programming
- /
- Graphics
- /
- proc gchart, vbar, fill/3d options + line chart
- RSS Feed
- Mark Topic as New
- Mark Topic as Read
- Float this Topic for Current User
- Bookmark
- Subscribe
- Mute
- Printer Friendly Page

- Mark as New
- Bookmark
- Subscribe
- Mute
- RSS Feed
- Permalink
- Report Inappropriate Content
Hello all!
I must certainly say that I like the new discussion forum capabilities!
At any rate, here goes my questions-
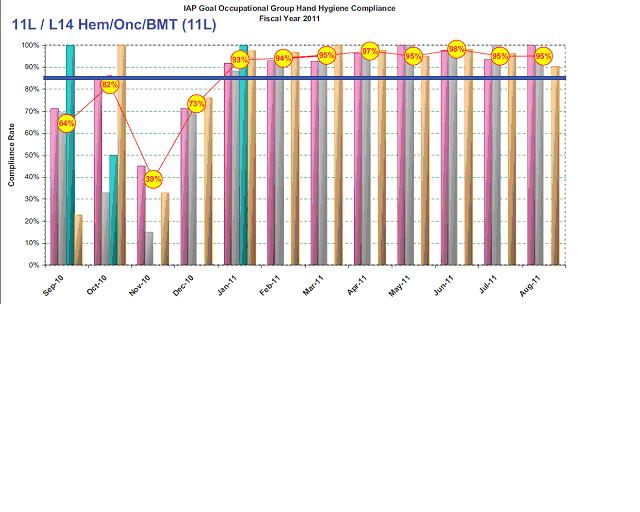
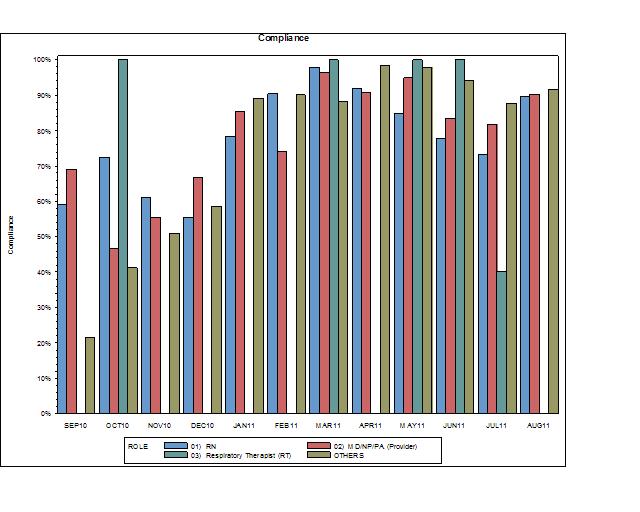
The chart to the left is produced by Excel. The one on the right is produced by SAS.
Question 1) The Excel graph It has a 2 tone schematic that gives some "depth". I am attempting to mimick that in the graph to the right.
Question 2) How I can incorporate a line graph that would be similar to the the one below that puts the numbers in red in a big yellow bubble.
The code is below. Fairly simple. I took it from one of the SAS websites. Any suggestions greatly appreciated. This is what management wants so I must oblige.
Titles, legends, and ref lines are no problem for me.
goptions reset=all cback=white border htitle=12pt htext=10pt;
/* Define the title */
title1 " Compliance";
/* Define the axis characteristics */
axis1 value=none label=none;
axis2 label=(angle=90 "Compliance");
axis3 label=none;
/* Define the legend options */
legend1 frame;
/* Generate the graph */
proc gchart data=L14;
vbar ROLE/ subgroup=ROLE group=fixdate sumvar=comply
legend=legend1 space=0 gspace=1
maxis=axis1 raxis=axis2 gaxis=axis3;
run;
quit;
Thank you.
Lawrence
Accepted Solutions

- Mark as New
- Bookmark
- Subscribe
- Mute
- RSS Feed
- Permalink
- Report Inappropriate Content
If you want to look into GTL, you can get most of what you want.
If you have SAS 9.3, you can do this as a Grouped Bar chart and Line overlay using PROC SGPLOT.
and use skins to get the 3D effect.
With SAS 9.2 (TS2M3) you can get this:
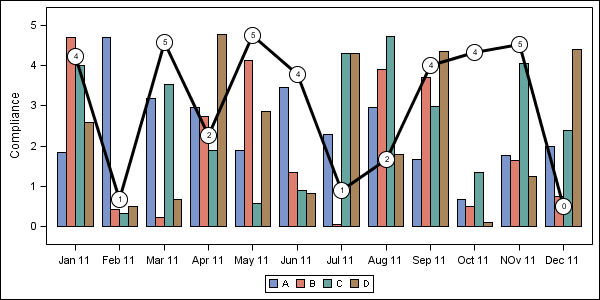
You have to set up your data as multiple columns (like Excel). Then overlay the bars and line as you need:
data BarLineMulti;
  format p 2.0;
  do Date='Jan 11', 'Feb 11', 'Mar 11', 'Apr 11', 'May 11', 'Jun 11',
          'Jul 11', 'Aug 11', 'Sep 11', 'Oct 11', 'NOv 11', 'Dec 11';
       A=5*ranuni(2);
       B=5*ranuni(2);
       C=5*ranuni(2);
       D=5*ranuni(2);
       P=5*ranuni(2);
       output;
  end;
  run;
  proc print;run;


proc template;
  define statgraph BarLineMulti;
    begingraph;
       layout overlay / xaxisopts=(display=(line ticks tickvalues))
                        yaxisopts=(label='Compliance') cycleattrs=true;
         barchart x=date y=a / discreteoffset=-0.3 barwidth=0.2 name='a';
          barchart x=date y=b / discreteoffset=-0.1 barwidth=0.2 name='b';
          barchart x=date y=c / discreteoffset= 0.1 barwidth=0.2 name='c';
          barchart x=date y=d / discreteoffset= 0.3 barwidth=0.2 name='d';
          seriesplot x=date y=p / lineattrs=graphdatadefault(thickness=3);
          scatterplot x=date y=p / markerattrs=(symbol=circlefilled size=20 color=black);
          scatterplot x=date y=p / markerattrs=(symbol=circlefilled size=18 color=white);
          scatterplot x=date y=p / markercharacter=p markercharacterattrs=(color=black);
          discretelegend 'a' 'b' 'c' 'd';
       endlayout;
     endgraph;
  end;
run;

ods listing;
ods graphics / reset width=6in height=3in imagename='Bar Line Multi';
proc sgrender data=BarLineMulti template=BarLineMulti;
run;

- Mark as New
- Bookmark
- Subscribe
- Mute
- RSS Feed
- Permalink
- Report Inappropriate Content
I do not recommend using 3d bar charts ...
But SAS/Graph gchart vbar does have some 3d-ish capabilities, and you can annotate a line onto the bar chart, as shown in this example:
http://robslink.com/SAS/democd11/oilbar.htm
http://robslink.com/SAS/democd11/oilbar_info.htm
With a grouped bar chart, it's a little more complex to do the annotation, because you have to also set a 'group' variable in your annotate data set (in addition to the 'midpoint' and 'y' variables).
If you can settle for simpler bar/line charts, check into "proc gbarline".
- Mark as New
- Bookmark
- Subscribe
- Mute
- RSS Feed
- Permalink
- Report Inappropriate Content
Thanks Robert.
I was wondering about that as I ran into some issues on missing "groups".
I get:
NOTE: PROBLEM IN OBSERVATION 1 -
CANNOT HAVE MISSING GROUP VALUE IF GROUPS ARE PRESENT
I wish I could do simple...that does not happen here as you can proably understand.
I find another example that I could set the size of the text. IS there also a way to insert a value?
Thanks for your help thus far. It helps.
Lawrence
- Mark as New
- Bookmark
- Subscribe
- Mute
- RSS Feed
- Permalink
- Report Inappropriate Content
Robert,
OK so I am stuck as I get errors including the anno statement as I am attempting to "group".
Some of the data looks accordingly:
| ROLE | fixdate | comply | compliance |
| 01) RN | Sep-10 | 0.592 | 0.493007 |
| 02) MD/NP/PA (Provider) | Sep-10 | 0.691176 | 0.493007 |
| OTHERS | Sep-10 | 0.215054 | 0.493007 |
| 01) RN | Oct-10 | 0.724638 | 0.567901 |
| 02) MD/NP/PA (Provider) | Oct-10 | 0.465517 | 0.567901 |
| 03) Respiratory Therapist (RT) | Oct-10 | 1 | 0.567901 |
| OTHERS | Oct-10 | 0.411765 | 0.567901 |
| 01) RN | Nov-10 | 0.611765 | 0.568182 |
| 02) MD/NP/PA (Provider) | Nov-10 | 0.555556 | 0.568182 |
| OTHERS | Nov-10 | 0.509091 | 0.568182 |
Where the compliance value is the overall value for the month (fixdate).
The anno statement is:
data anno;
length function color $ 8 text $ 10;
retain xsys ysys '2' when 'a';
set totals2 end=last;
by fixdate;
if _n_ = 1 then function='move';
else function='draw';
xsys='2'; ysys='2';
x=fixdate; y=compliance; size=2;color='yellow';
output;
function='symbol';
xsys='2'; ysys='2';
x=fixdate; y=compliance;
text='dot'; size=8; color='yellow';
output;
run;
So I am attempting to group by using a BY statement per what I am reading online.
Then I go back to the proc gchart statement:
/* Generate the graph */
proc gchart data=total3;
vbar ROLE/ subgroup=ROLE group=fixdate anno=anno sumvar=comply
legend=legend1 space=0 gspace=1
maxis=axis1 raxis=axis2 gaxis=axis3;
run;
quit;
Where I run into a problem. I will attempt to reverse engineer the examples.
Thanks again.
Lawrence
- Mark as New
- Bookmark
- Subscribe
- Mute
- RSS Feed
- Permalink
- Report Inappropriate Content
If you want to look into GTL, you can get most of what you want.
If you have SAS 9.3, you can do this as a Grouped Bar chart and Line overlay using PROC SGPLOT.
and use skins to get the 3D effect.
With SAS 9.2 (TS2M3) you can get this:
You have to set up your data as multiple columns (like Excel). Then overlay the bars and line as you need:
data BarLineMulti;
  format p 2.0;
  do Date='Jan 11', 'Feb 11', 'Mar 11', 'Apr 11', 'May 11', 'Jun 11',
          'Jul 11', 'Aug 11', 'Sep 11', 'Oct 11', 'NOv 11', 'Dec 11';
       A=5*ranuni(2);
       B=5*ranuni(2);
       C=5*ranuni(2);
       D=5*ranuni(2);
       P=5*ranuni(2);
       output;
  end;
  run;
  proc print;run;


proc template;
  define statgraph BarLineMulti;
    begingraph;
       layout overlay / xaxisopts=(display=(line ticks tickvalues))
                        yaxisopts=(label='Compliance') cycleattrs=true;
         barchart x=date y=a / discreteoffset=-0.3 barwidth=0.2 name='a';
          barchart x=date y=b / discreteoffset=-0.1 barwidth=0.2 name='b';
          barchart x=date y=c / discreteoffset= 0.1 barwidth=0.2 name='c';
          barchart x=date y=d / discreteoffset= 0.3 barwidth=0.2 name='d';
          seriesplot x=date y=p / lineattrs=graphdatadefault(thickness=3);
          scatterplot x=date y=p / markerattrs=(symbol=circlefilled size=20 color=black);
          scatterplot x=date y=p / markerattrs=(symbol=circlefilled size=18 color=white);
          scatterplot x=date y=p / markercharacter=p markercharacterattrs=(color=black);
          discretelegend 'a' 'b' 'c' 'd';
       endlayout;
     endgraph;
  end;
run;

ods listing;
ods graphics / reset width=6in height=3in imagename='Bar Line Multi';
proc sgrender data=BarLineMulti template=BarLineMulti;
run;
- Mark as New
- Bookmark
- Subscribe
- Mute
- RSS Feed
- Permalink
- Report Inappropriate Content
With a gchart vbar, rather than an y= and a x= value (as your code has), annotate needs a y= and a midpoint= (and since you are using a grouped bar chart, it would also need a group=). Since Sanjay has provided some complete code of an alternate way how to do this with sgplot, I'd recommend using that ![]() (but as Sanjay says, you'll need the recently-released SAS 9.3)
(but as Sanjay says, you'll need the recently-released SAS 9.3)
I went back through all my examples, and found that I do have 1 old (and admittedly ugly) example that shows a grouped bar with annotated line, if that might help:
- Mark as New
- Bookmark
- Subscribe
- Mute
- RSS Feed
- Permalink
- Report Inappropriate Content
The code I proveded is for SAS 9.2 (TS2M3).
- Mark as New
- Bookmark
- Subscribe
- Mute
- RSS Feed
- Permalink
- Report Inappropriate Content
Rob & Sanjay-
Thank you both for your very helpful answers! Different approaches that help immensely for different purposes.
I will go back Rob and take a look at the last example.
Best,
Lawrence
- Mark as New
- Bookmark
- Subscribe
- Mute
- RSS Feed
- Permalink
- Report Inappropriate Content
Sanjay-
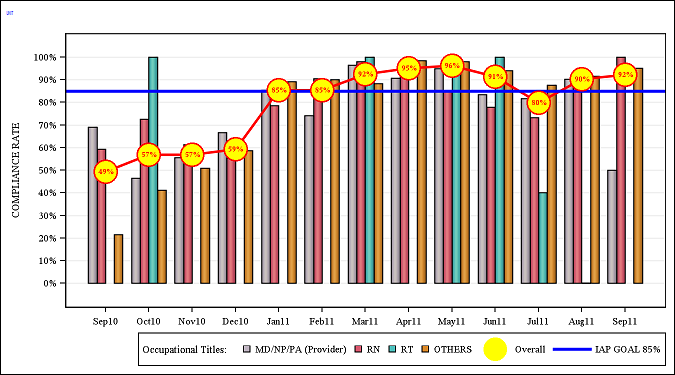
OK I have made a lot of progress as you can see below from the code that you gave me.
There are two finishing touches that I am trying to make but I cannot find the answers anywhere online.
1) I am attempting to shift the order of the Occupational titles so that RN's come first. However, no matter if I switch the order in the data set or set the RN's first in the proc template statement does the order change.
2) AS you see below I managed to make red circles around the yellow by adding a second scatterplot code accordingly.
scatterplot x=date y=P /skin=modern markerattrs=(symbol=circlefilled size=30 color=yellow) name="Overall" legendlabel="Overall";
scatterplot x=date y=P /skin=modern markerattrs=(symbol=circle size=31 color=red) ;
However, I can't mimic it in the legend. I attempted to use endcolor but that does not work.
Full code follows below-Any advice greatly appreciated.
Thanks,
Lawrence
proc template;
define statgraph BarLineMulti;
begingraph;
entrytitle halign=left TEXTATTRS=(color=blue size=16pt) "14L" ;
layout overlay / xaxisopts=(display=(line ticks tickvalues )) cycleattrs=true yaxisopts=(LABEL=('COMPLIANCE RATE') griddisplay=on linearopts=(tickvaluesequence=(start=0 end=1 increment=.1))) ;
barchart x=date y=RNG / skin=modern FILLATTRS =(color=STPK) discreteoffset=-0.1 barwidth=0.2 name="RN" legendlabel="RN";
barchart x=date y=MDG /skin=modern FILLATTRS =(color=LIPGR) discreteoffset=-0.3 barwidth=0.2 NAME="MD/NP/PA (Provider)" legendlabel="MD/NP/PA (Provider)";
barchart x=date y=RTG /skin=modern FILLATTRS =(color=BIBG) discreteoffset= 0.1 barwidth=0.2 name="RT" legendlabel="RT";
barchart x=date y=OTHERS /skin=modern FILLATTRS =(color=BIO) discreteoffset= 0.3 barwidth=0.2 name='OTHERS';
seriesplot x=date y=p / lineattrs=graphdatadefault(thickness=3 color=red) ;
ReferenceLine y=.85 / clip=true Lineattrs=( Pattern=solid thickness=4 color=blue) name="IAP GOAL 85%" legendlabel="IAP GOAL 85%";
scatterplot x=date y=P /skin=modern markerattrs=(symbol=circlefilled size=30 color=yellow endcolor=red) name="Overall" legendlabel="Overall";
*scatterplot x=date y=P /skin=modern markerattrs=(symbol=circle size=31 color=red) ;
scatterplot x=date y=P / markercharacter=p discreteoffset= -0.1 markercharacterattrs=(color=red weight=bold);
discretelegend "MD/NP/PA (Provider)" "RN" "RT" 'OTHERS' "Overall" "IAP GOAL 85%" / title="Occupational Titles:"
location=outside halign=right valign=bottom;
endlayout;
endgraph;
end;
run;
- Mark as New
- Bookmark
- Subscribe
- Mute
- RSS Feed
- Permalink
- Report Inappropriate Content
I don't have access to my computer, but I can answer some of your questions.
- To get the order you want in the legend, siimply provide the plot names in the order you want on the DISCRETELEGEND statement. So change it to: DISCRETELEGEND 'RN' 'RT' 'MD/NP/PA (Provider)' and so on. Of course, it is nice to have them in the same order in the plot (use the correct DiscreteOffset values).
- There is no way to get two overlaid markers in the legend. We have plans to address that. However, one way around this is to not put "Overall" in the legend at all. Instead, use the CURVELABEL option on the SERIESPLOT to display the label "Overall" at the end of the line itself. Personally, I like such direct labeling of series, as it reduces eye movement needed to decode the data. You can also do this with the reference line.
- Note SKIN=modern works only with bar chart, and has no effect on any other plot type. This will change at a future release.
If you still need it, I will send code in the morning.
- Mark as New
- Bookmark
- Subscribe
- Mute
- RSS Feed
- Permalink
- Report Inappropriate Content
Sanjay-
Thanks for the guidance. No code is needed.
Have a great Tuesday!
~Lawrence
- Mark as New
- Bookmark
- Subscribe
- Mute
- RSS Feed
- Permalink
- Report Inappropriate Content
Of course a simpler solution is to move that NAME and LEGENDLABEL to the SERIESPLOT (with the red line) and include it in the legend. 🙂
- Mark as New
- Bookmark
- Subscribe
- Mute
- RSS Feed
- Permalink
- Report Inappropriate Content
That is what I ended up doing. Of course I found something called legend item that could be an image perhaps?
The number of options is both a blessing and a curse!
Lawrence
- Mark as New
- Bookmark
- Subscribe
- Mute
- RSS Feed
- Permalink
- Report Inappropriate Content
Legend Item is a SAS 9.3 feature. Images for legend items are planned (future). But, I thought you were using SAS 9.2.
If you are using SAS 9.3, you have more options. You can use PROC SGPLOT to do the same graph. You can use grouped data with GROUPDISPLAY=CLUSTER. The SGPLOT procedure is designed to hide the GTL complexity from where not needed.
With SAS 9.2 you have to use GTL with mulit column data to get this result.
- Mark as New
- Bookmark
- Subscribe
- Mute
- RSS Feed
- Permalink
- Report Inappropriate Content
Sanjay-
I am using 9.2 ver 3 and for now I will keep as is!
Thanks again for all your help!
Lawrence
.jpg")
Catch up on SAS Innovate 2026
Nearly 200 sessions are now available on demand with the SAS Innovate Digital Pass.
Explore Now →Learn how use the CAT functions in SAS to join values from multiple variables into a single value.

Find more tutorials on the SAS Users YouTube channel.
SAS Training: Just a Click Away
Ready to level-up your skills? Choose your own adventure.
-
28 replies
-
09-13-2011 03:26 PM
-
13070 views
-
6 likes
-
5 in conversation
-
