Hello @romangelzhaeuse,
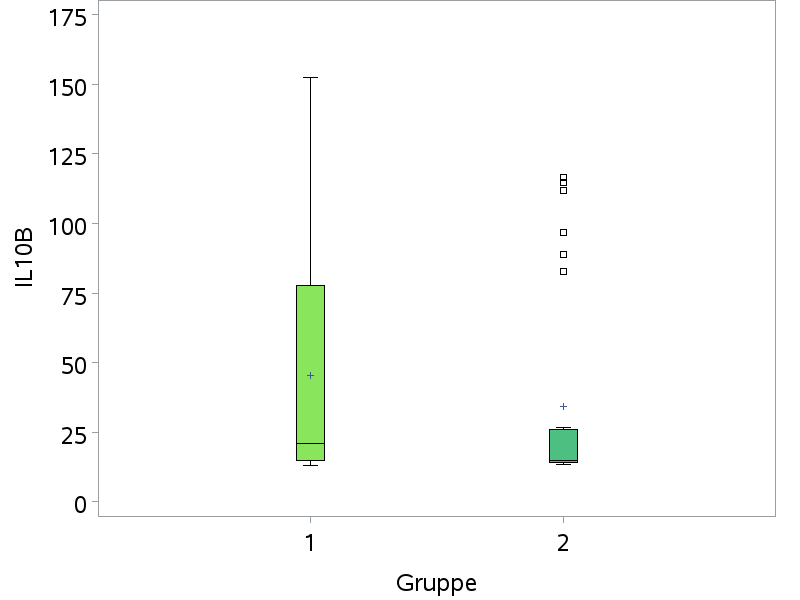
I think SAS arbitrarily decides to deviate from the axis specification just because one or a few values in Gruppe 1 slightly exceed the maximum tick mark value of 150 (this behavior is really annoying), see warnings in the log:
WARNING: For process variable IL10B the VAXIS= values specified do not cover the data range.
WARNING: Default scaling is substituted.
A workaround is an axis specification that does "cover the data range" and to suppress the newly introduced tick mark values:
axis1 order=(0 to 175 by 25) value=(t=2 '' t=4 '' t=6 '' t=8 '');
(I think "0 to 200 by 50" would leave too much white space.)
Then specify vaxis=axis1 in the PLOT statement. More effort (probably involving the annotate feature) would be required to suppress the new tick marks, too.