- Home
- /
- Programming
- /
- Graphics
- /
- order groups in sgplot vbar
- RSS Feed
- Mark Topic as New
- Mark Topic as Read
- Float this Topic for Current User
- Bookmark
- Subscribe
- Mute
- Printer Friendly Page

- Mark as New
- Bookmark
- Subscribe
- Mute
- RSS Feed
- Permalink
- Report Inappropriate Content
Hi,
I am trying to make an sgplot vbar with grouped values in order to apply a certain color to certain bars
But I can't choose the order of grouping (0 should be green, 1 yellow, 2 orange and 3 red).
Is there a way to do that ?
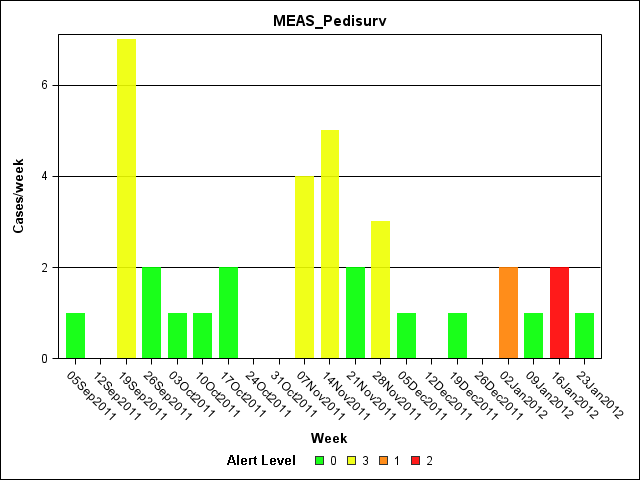
Here is my code :
%let path='P:\testing\AlertLevels\graphs\';
proc template;
define style styles.alertlevels;
parent=styles.default;
style body from body / background = white;
class graphgridlines / contrastcolor=black;
class graphbackground / color=white;
class graphwalls / color=white;
class GraphData1 / color=CX00FF00; /* green a00FF0066*/
class GraphData2 / color=CxEEFF00; /* yellow */
class GraphData3 / color=CXFF8000; /* orange */
class GraphData4 / color=CXFF0000; /* red */
end;
run;
ods _all_ close;
goptions device=png;
ods html file='Ptests.html' path=&path style=alertlevels;
ods graphics on / reset=all imagename=&PathogenSource2;
proc sgplot data=PTEST_&PathogenSource;
vbar Date / response=Cases group=AlertLevel nooutline barwidth=.7 transparency=.1 name='zut';
xaxis label = 'Week' fitpolicy=rotatethin;
yaxis label = 'Cases/week' grid;
title &PathogenSource;
keylegend 'zut' / noborder title='Alert Level';
run;
Accepted Solutions

- Mark as New
- Bookmark
- Subscribe
- Mute
- RSS Feed
- Permalink
- Report Inappropriate Content
The reason that I asked about the SAS version is that, in SAS 9.3, we added functionality to the SG procedures that gives you the ability to assign visual attributes to group values. Since you're running SAS 9.2, the best solution is to use the Graph Template Language (GTL) and the INDEX option to index into the style. The INDEX takes a one-based column that references the number of the GraphDataN style element. You can make this column data step by just adding 1 to your alert level. Below is a little sample for you to see how the option works.
Hope this helps!
Dan
data levels;
informat date date7.;
format date date7.;
input date resp level style;
cards;
01jan11 12 1 2
01feb11 22 1 2
01mar11 32 2 3
01apr11 42 3 4
01may11 52 1 2
01jun11 12 1 2
01jul11 22 2 3
01aug11 32 3 4
01sep11 42 0 1
01oct11 52 1 2
01nov11 12 2 3
01dec11 22 3 4
;
run;
proc template;
define statgraph barchart;
begingraph;
layout overlay;
barchart x=date y=resp / group=level index=style;
endlayout;
endgraph;
end;
run;
proc sgrender data=levels template=barchart; run;
- Mark as New
- Bookmark
- Subscribe
- Mute
- RSS Feed
- Permalink
- Report Inappropriate Content
What version of SAS do you have?
- Mark as New
- Bookmark
- Subscribe
- Mute
- RSS Feed
- Permalink
- Report Inappropriate Content
I have SAS Enterprise Guide 4.3 with SAS 9.2

- Mark as New
- Bookmark
- Subscribe
- Mute
- RSS Feed
- Permalink
- Report Inappropriate Content
Have you tried sorting the data by AlertLevel? It may be that the color assignment is being done by the order the group variable appears in the data.
- Mark as New
- Bookmark
- Subscribe
- Mute
- RSS Feed
- Permalink
- Report Inappropriate Content
I just tried.
But no, it doesn't change anything.
- Mark as New
- Bookmark
- Subscribe
- Mute
- RSS Feed
- Permalink
- Report Inappropriate Content
The reason that I asked about the SAS version is that, in SAS 9.3, we added functionality to the SG procedures that gives you the ability to assign visual attributes to group values. Since you're running SAS 9.2, the best solution is to use the Graph Template Language (GTL) and the INDEX option to index into the style. The INDEX takes a one-based column that references the number of the GraphDataN style element. You can make this column data step by just adding 1 to your alert level. Below is a little sample for you to see how the option works.
Hope this helps!
Dan
data levels;
informat date date7.;
format date date7.;
input date resp level style;
cards;
01jan11 12 1 2
01feb11 22 1 2
01mar11 32 2 3
01apr11 42 3 4
01may11 52 1 2
01jun11 12 1 2
01jul11 22 2 3
01aug11 32 3 4
01sep11 42 0 1
01oct11 52 1 2
01nov11 12 2 3
01dec11 22 3 4
;
run;
proc template;
define statgraph barchart;
begingraph;
layout overlay;
barchart x=date y=resp / group=level index=style;
endlayout;
endgraph;
end;
run;
proc sgrender data=levels template=barchart; run;
- Mark as New
- Bookmark
- Subscribe
- Mute
- RSS Feed
- Permalink
- Report Inappropriate Content
This worked really well.
It was a bit more tricky to get the same result.
Thank you very much Dan
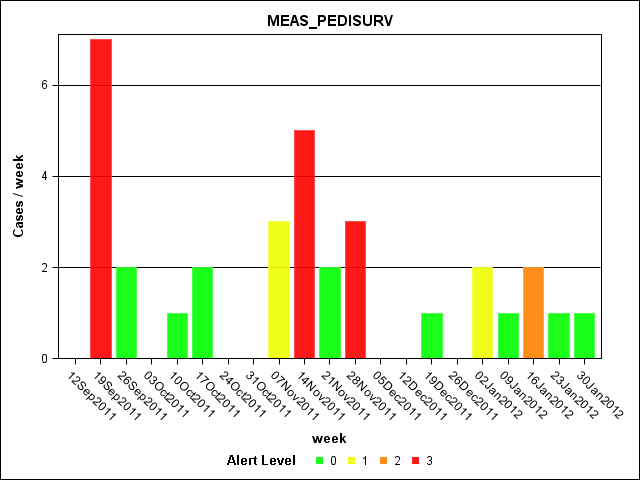
proc template;
define statgraph barchart;
begingraph / border=false;
title;
entrytitle 'MEAS_PEDISURV';
layout overlay / yaxisopts=(label='Cases / week' griddisplay=on) xaxisopts=(label='week');
barchart x=Date y=Cases / group=AlertLevel index=index barwidth=.8
name='zut' outlineattrs=(thickness=0 color=white)
datatransparency=.1 legendlabel='Alert Level' grouporder=ascending;
discretelegend 'zut'/ border=false title='Alert Level';
endlayout;
endgraph;
end;
run;
.jpg")
Catch up on SAS Innovate 2026
Nearly 200 sessions are now available on demand in the Innovate Hub.
Watch Now →Learn how use the CAT functions in SAS to join values from multiple variables into a single value.

Find more tutorials on the SAS Users YouTube channel.
SAS Training: Just a Click Away
Ready to level-up your skills? Choose your own adventure.
-
6 replies
-
02-02-2012 10:36 AM
-
10228 views
-
3 likes
-
3 in conversation
-
