- Home
- /
- Programming
- /
- Graphics
- /
- justfiying text on a forest plot
- RSS Feed
- Mark Topic as New
- Mark Topic as Read
- Float this Topic for Current User
- Bookmark
- Subscribe
- Mute
- Printer Friendly Page

- Mark as New
- Bookmark
- Subscribe
- Mute
- RSS Feed
- Permalink
- Report Inappropriate Content
I have a forest plot and hanving read the previous papers about indenting text and the subgroup issue I have a fairly similar piece of code to everyone else. However, even though Im using a non-proportional font (as per other example) and output to pdf rather than doc, Im still getting my columns centre justified.
any help would be appreciated. Ive attached the code, pdf and png file.
Thanks.

Accepted Solutions

- Mark as New
- Bookmark
- Subscribe
- Mute
- RSS Feed
- Permalink
- Report Inappropriate Content
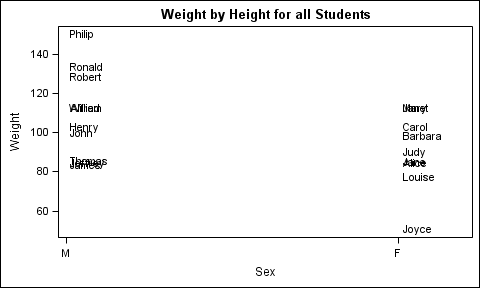
When you use the MARKERCHARACTER to display such labels, the text string is always placed center justified with the location of the marker (not drawn). So, you would have to jump through some hoops to get the alignment you want, even with the non-proportional fonts.
However, with SAS 9.3, you have more options. SAS 9.3 supports a user specified data label position for the scatter plot. So, instead of using MarkerCharacter, change you code to use regular scatterplot with DataLabel. Use DataLabelPosition =LEFT or RIGHT or CENTER as needed. Proportional fonts will be OK. Set marker size to zero. Here is some sample code.
proc template;
define statgraph datalabel;
dynamic _pos;
begingraph;
entrytitle 'Weight by Height for all Students';
layout overlay;
scatterplot x=sex y=weight / datalabel=name datalabelposition=_pos markerattrs=(size=0);
endlayout;
endgraph;
end;
run;
ods graphics / reset width=5in height=3in imagename='datalabel_left';
proc sgrender data=sashelp.class template=datalabel;
dynamic _pos='left';
run;
ods graphics / reset width=5in height=3in imagename='datalabel_right';
proc sgrender data=sashelp.class template=datalabel;
dynamic _pos='right';
run;
- Mark as New
- Bookmark
- Subscribe
- Mute
- RSS Feed
- Permalink
- Report Inappropriate Content
....using SAS 9.3.
- Mark as New
- Bookmark
- Subscribe
- Mute
- RSS Feed
- Permalink
- Report Inappropriate Content
When you use the MARKERCHARACTER to display such labels, the text string is always placed center justified with the location of the marker (not drawn). So, you would have to jump through some hoops to get the alignment you want, even with the non-proportional fonts.
However, with SAS 9.3, you have more options. SAS 9.3 supports a user specified data label position for the scatter plot. So, instead of using MarkerCharacter, change you code to use regular scatterplot with DataLabel. Use DataLabelPosition =LEFT or RIGHT or CENTER as needed. Proportional fonts will be OK. Set marker size to zero. Here is some sample code.
proc template;
define statgraph datalabel;
dynamic _pos;
begingraph;
entrytitle 'Weight by Height for all Students';
layout overlay;
scatterplot x=sex y=weight / datalabel=name datalabelposition=_pos markerattrs=(size=0);
endlayout;
endgraph;
end;
run;
ods graphics / reset width=5in height=3in imagename='datalabel_left';
proc sgrender data=sashelp.class template=datalabel;
dynamic _pos='left';
run;
ods graphics / reset width=5in height=3in imagename='datalabel_right';
proc sgrender data=sashelp.class template=datalabel;
dynamic _pos='right';
run;
- Mark as New
- Bookmark
- Subscribe
- Mute
- RSS Feed
- Permalink
- Report Inappropriate Content
Brilliant. Thanks. that worked perfectly.
- Mark as New
- Bookmark
- Subscribe
- Mute
- RSS Feed
- Permalink
- Report Inappropriate Content
See new blog article.
.jpg")
Catch up on SAS Innovate 2026
Nearly 200 sessions are now available on demand in the Innovate Hub.
Watch Now →Learn how use the CAT functions in SAS to join values from multiple variables into a single value.

Find more tutorials on the SAS Users YouTube channel.
SAS Training: Just a Click Away
Ready to level-up your skills? Choose your own adventure.
-
4 replies
-
01-29-2014 11:42 AM
-
4057 views
-
0 likes
-
2 in conversation
-
