- Home
- /
- Programming
- /
- Graphics
- /
- gplot axis monthly tick marks
- RSS Feed
- Mark Topic as New
- Mark Topic as Read
- Float this Topic for Current User
- Bookmark
- Subscribe
- Mute
- Printer Friendly Page

- Mark as New
- Bookmark
- Subscribe
- Mute
- RSS Feed
- Permalink
- Report Inappropriate Content
Hi,
running EG4.3 on SAS92 on Windows.
I want to create a gplot with months on the horizontal axis, like:
work.x;
do date='01jan12'd to '31dec12'd;
actual=1000;
output;
end;
format date date9.;
run;
axis1 order='01jan12'd to '31dec12'd by month;
proc gplot data=work.x;
plot actual*date / haxis=axis1;
run;quit;
my graph looks like this:
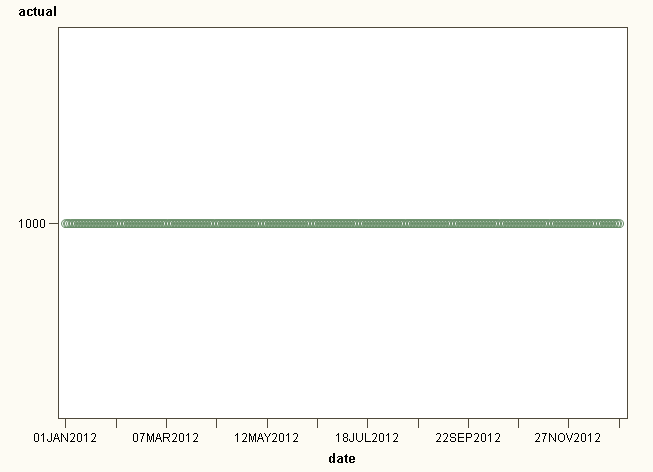
the horizontal axis is strange, what did I do wrong?
thanks, Bart

- Mark as New
- Bookmark
- Subscribe
- Mute
- RSS Feed
- Permalink
- Report Inappropriate Content
hi ... first, you cannot do this by month ... axis1 order='01jan12'd to '31dec12'd by month;
since the end date does not allow an entire month interval and you will not get any dates in December other than 12/01
but you can do this ... axis1 order='01jan12'd to '01jan13'd by month;
second, I tried your code in both V9.1 and V9.3 and got the attached
they are both from V9.3 and they both worked better than what you are showing ... are you showing all the various options that are in place
did you try starting with GOPTIONS RESET=ALL;
ps I'm NOT using EG so I have no idea if that's the issue here


- Mark as New
- Bookmark
- Subscribe
- Mute
- RSS Feed
- Permalink
- Report Inappropriate Content
both your suggestions:
- to '01jan13'd
- goptions reset=all
solved the problem.
wrt 2, looks like eg sets some goptions that I'm not aware of.
thanks, Bart
.jpg")
Catch up on SAS Innovate 2026
Nearly 200 sessions are now available on demand in the Innovate Hub.
Watch Now →Learn how use the CAT functions in SAS to join values from multiple variables into a single value.

Find more tutorials on the SAS Users YouTube channel.
SAS Training: Just a Click Away
Ready to level-up your skills? Choose your own adventure.
-
2 replies
-
04-19-2012 05:33 PM
-
3312 views
-
1 like
-
2 in conversation
-
