- Home
- /
- Programming
- /
- Graphics
- /
- gchart hbar graph is smashed vertically
- RSS Feed
- Mark Topic as New
- Mark Topic as Read
- Float this Topic for Current User
- Bookmark
- Subscribe
- Mute
- Printer Friendly Page

- Mark as New
- Bookmark
- Subscribe
- Mute
- RSS Feed
- Permalink
- Report Inappropriate Content
Hello World,
It should be obvious I am a graph noob, but I cannot figure out what I have done to mess this up. I have a program that automatically makes hundreds of gchart vbar images within a macro (and that works fine), but then when it gets to drawing a set of hundreds of hbar images for some reason all my images are smashed horizontally. I have created a sample program that replicates the error, and have an example image showing the problem -- both are attached. At this point I would welcome any suggestions. (I have a feeling it is some ODS global value that I have set on my system -- but I cannot figure out what.)
Thanks,
Rich
----------------------
This code recreates the error -- sorry about using 11x27 data points
---------------------
data show_problem;
input Gene_ID $ id Treatment $ bio_rep tech_rep intensity cat $;
cards;
Test 3 con 1 4 -1.04426 Xcon1
Test 4 con 1 4 -0.75208 Xcon1
Test 5 con 1 4 -0.93848 Xcon1
Test 6 con 1 4 -0.96545 Xcon1
Test 7 con 1 4 0.41823 Xcon1
Test 8 con 1 4 -0.39572 Xcon1
Test 9 con 1 4 0.32497 Xcon1
Test 10 con 1 4 -0.23036 Xcon1
Test 11 con 1 4 -0.30929 Xcon1
Test 12 con 1 4 -0.91253 Xcon1
Test 13 con 1 4 0.49469 Xcon1
Test 3 con 1 5 -0.40658 Xcon2
Test 4 con 1 5 -0.73589 Xcon2
Test 5 con 1 5 -0.81963 Xcon2
Test 6 con 1 5 -1.35643 Xcon2
Test 7 con 1 5 -0.89986 Xcon2
Test 8 con 1 5 -0.17202 Xcon2
Test 9 con 1 5 -1.58865 Xcon2
Test 10 con 1 5 -1.81025 Xcon2
Test 11 con 1 5 0.30599 Xcon2
Test 12 con 1 5 -0.25008 Xcon2
Test 13 con 1 5 1.51573 Xcon2
Test 3 con 1 6 -0.9487 Xcon3
Test 4 con 1 6 -1.42223 Xcon3
Test 5 con 1 6 -1.68954 Xcon3
Test 6 con 1 6 -0.58633 Xcon3
Test 7 con 1 6 0.17923 Xcon3
Test 8 con 1 6 0.11763 Xcon3
Test 9 con 1 6 -0.11029 Xcon3
Test 10 con 1 6 0.41846 Xcon3
Test 11 con 1 6 0.11584 Xcon3
Test 12 con 1 6 -0.66876 Xcon3
Test 13 con 1 6 0.18322 Xcon3
Test 3 con 1 7 -0.82115 Xcon4
Test 4 con 1 7 -0.74408 Xcon4
Test 5 con 1 7 -1.04683 Xcon4
Test 6 con 1 7 -0.49043 Xcon4
Test 7 con 1 7 -0.30913 Xcon4
Test 8 con 1 7 0.39979 Xcon4
Test 9 con 1 7 -1.01654 Xcon4
Test 10 con 1 7 0.67506 Xcon4
Test 11 con 1 7 0.5709 Xcon4
Test 12 con 1 7 -0.70749 Xcon4
Test 13 con 1 7 1.05587 Xcon4
Test 3 con 2 4 -1.15406 Ycon1
Test 4 con 2 4 -1.69927 Ycon1
Test 5 con 2 4 -0.99067 Ycon1
Test 6 con 2 4 -1.09595 Ycon1
Test 7 con 2 4 -0.53975 Ycon1
Test 8 con 2 4 -0.50261 Ycon1
Test 9 con 2 4 -0.54688 Ycon1
Test 10 con 2 4 -1.04623 Ycon1
Test 11 con 2 4 -0.83245 Ycon1
Test 12 con 2 4 -1.15542 Ycon1
Test 13 con 2 4 -0.24218 Ycon1
Test 3 con 2 5 -1.73176 Ycon2
Test 4 con 2 5 -1.43622 Ycon2
Test 5 con 2 5 0.32822 Ycon2
Test 6 con 2 5 -1.52065 Ycon2
Test 7 con 2 5 -1.63266 Ycon2
Test 8 con 2 5 -1.7197 Ycon2
Test 9 con 2 5 -0.48889 Ycon2
Test 10 con 2 5 -2.33808 Ycon2
Test 11 con 2 5 -0.17031 Ycon2
Test 12 con 2 5 -1.45565 Ycon2
Test 13 con 2 5 -0.29088 Ycon2
Test 3 con 2 6 -1.35705 Ycon3
Test 4 con 2 6 -1.63129 Ycon3
Test 5 con 2 6 -0.74707 Ycon3
Test 6 con 2 6 -1.81662 Ycon3
Test 7 con 2 6 -0.51053 Ycon3
Test 8 con 2 6 -0.60539 Ycon3
Test 9 con 2 6 -0.66691 Ycon3
Test 10 con 2 6 -0.43112 Ycon3
Test 11 con 2 6 -0.36499 Ycon3
Test 12 con 2 6 -1.23157 Ycon3
Test 13 con 2 6 -0.28296 Ycon3
Test 3 con 2 7 -1.37582 Ycon4
Test 4 con 2 7 -1.53112 Ycon4
Test 5 con 2 7 -0.51335 Ycon4
Test 6 con 2 7 -1.08473 Ycon4
Test 7 con 2 7 -0.48584 Ycon4
Test 8 con 2 7 -0.41958 Ycon4
Test 9 con 2 7 -0.63718 Ycon4
Test 10 con 2 7 -0.17142 Ycon4
Test 11 con 2 7 -0.2421 Ycon4
Test 12 con 2 7 -1.41841 Ycon4
Test 13 con 2 7 -0.72472 Ycon4
Test 3 con 3 4 -0.16013 Zcon1
Test 4 con 3 4 0.80472 Zcon1
Test 5 con 3 4 -0.15884 Zcon1
Test 6 con 3 4 -0.15732 Zcon1
Test 7 con 3 4 -1.44139 Zcon1
Test 8 con 3 4 -2.63761 Zcon1
Test 9 con 3 4 -0.51574 Zcon1
Test 10 con 3 4 0.05586 Zcon1
Test 11 con 3 4 -0.64836 Zcon1
Test 12 con 3 4 -1.54116 Zcon1
Test 13 con 3 4 -0.7322 Zcon1
Test 3 con 3 5 -0.27476 Zcon2
Test 4 con 3 5 0.3498 Zcon2
Test 5 con 3 5 0.37722 Zcon2
Test 6 con 3 5 -0.23973 Zcon2
Test 7 con 3 5 0.53386 Zcon2
Test 8 con 3 5 0.40892 Zcon2
Test 9 con 3 5 0.5426 Zcon2
Test 10 con 3 5 0.72467 Zcon2
Test 11 con 3 5 0.58146 Zcon2
Test 12 con 3 5 -0.672 Zcon2
Test 13 con 3 5 0.54256 Zcon2
Test 3 con 3 6 -0.37922 Zcon3
Test 4 con 3 6 0.42877 Zcon3
Test 5 con 3 6 -0.98211 Zcon3
Test 6 con 3 6 -0.41418 Zcon3
Test 7 con 3 6 -0.01306 Zcon3
Test 8 con 3 6 -0.11285 Zcon3
Test 9 con 3 6 0.93354 Zcon3
Test 10 con 3 6 0.31953 Zcon3
Test 11 con 3 6 -0.1432 Zcon3
Test 12 con 3 6 -0.19108 Zcon3
Test 13 con 3 6 0.54169 Zcon3
Test 3 con 3 7 -0.45371 Zcon4
Test 4 con 3 7 0.66261 Zcon4
Test 5 con 3 7 -1.46487 Zcon4
Test 6 con 3 7 -0.512 Zcon4
Test 7 con 3 7 -0.63025 Zcon4
Test 8 con 3 7 0.65281 Zcon4
Test 9 con 3 7 0.21266 Zcon4
Test 10 con 3 7 2.15363 Zcon4
Test 11 con 3 7 -0.97697 Zcon4
Test 12 con 3 7 -0.27644 Zcon4
Test 13 con 3 7 0.28072 Zcon4
Test 3 nav 1 1 1.07587 Xnav1
Test 4 nav 1 1 0.6893 Xnav1
Test 5 nav 1 1 0.65689 Xnav1
Test 6 nav 1 1 0.38815 Xnav1
Test 7 nav 1 1 0.35672 Xnav1
Test 8 nav 1 1 -0.2102 Xnav1
Test 9 nav 1 1 0.46271 Xnav1
Test 10 nav 1 1 0.94126 Xnav1
Test 11 nav 1 1 -1.64921 Xnav1
Test 12 nav 1 1 0.90543 Xnav1
Test 13 nav 1 1 -1.80394 Xnav1
Test 3 nav 1 2 0.78171 Xnav2
Test 4 nav 1 2 0.30054 Xnav2
Test 5 nav 1 2 -0.72317 Xnav2
Test 6 nav 1 2 0.55638 Xnav2
Test 7 nav 1 2 0.56648 Xnav2
Test 8 nav 1 2 0.11133 Xnav2
Test 9 nav 1 2 1.25007 Xnav2
Test 10 nav 1 2 0.81052 Xnav2
Test 11 nav 1 2 -2.58952 Xnav2
Test 12 nav 1 2 0.61449 Xnav2
Test 13 nav 1 2 -0.92857 Xnav2
Test 3 nav 1 3 1.06136 Xnav3
Test 4 nav 1 3 0.81758 Xnav3
Test 5 nav 1 3 0.35617 Xnav3
Test 6 nav 1 3 0.95212 Xnav3
Test 7 nav 1 3 -0.22216 Xnav3
Test 8 nav 1 3 -0.04673 Xnav3
Test 9 nav 1 3 0.8458 Xnav3
Test 10 nav 1 3 0.38211 Xnav3
Test 11 nav 1 3 0.52518 Xnav3
Test 12 nav 1 3 0.92039 Xnav3
Test 13 nav 1 3 -2.21101 Xnav3
Test 3 nav 2 1 1.51426 Ynav1
Test 4 nav 2 1 0.19441 Ynav1
Test 5 nav 2 1 0.98635 Ynav1
Test 6 nav 2 1 1.1428 Ynav1
Test 7 nav 2 1 2.10879 Ynav1
Test 8 nav 2 1 1.06978 Ynav1
Test 9 nav 2 1 0.71963 Ynav1
Test 10 nav 2 1 0.10317 Ynav1
Test 11 nav 2 1 -0.44679 Ynav1
Test 12 nav 2 1 1.1501 Ynav1
Test 13 nav 2 1 -0.22396 Ynav1
Test 3 nav 2 2 1.42313 Ynav2
Test 4 nav 2 2 0.24009 Ynav2
Test 5 nav 2 2 0.76967 Ynav2
Test 6 nav 2 2 1.03811 Ynav2
Test 7 nav 2 2 0.60148 Ynav2
Test 8 nav 2 2 1.64842 Ynav2
Test 9 nav 2 2 -0.70274 Ynav2
Test 10 nav 2 2 0.29316 Ynav2
Test 11 nav 2 2 0.77087 Ynav2
Test 12 nav 2 2 1.19717 Ynav2
Test 13 nav 2 2 1.36789 Ynav2
Test 3 nav 2 3 1.16407 Ynav3
Test 4 nav 2 3 0.31836 Ynav3
Test 5 nav 2 3 0.28513 Ynav3
Test 6 nav 2 3 0.98636 Ynav3
Test 7 nav 2 3 0.47327 Ynav3
Test 8 nav 2 3 1.79585 Ynav3
Test 9 nav 2 3 -0.18316 Ynav3
Test 10 nav 2 3 -0.30646 Ynav3
Test 11 nav 2 3 0.27318 Ynav3
Test 12 nav 2 3 0.95275 Ynav3
Test 13 nav 2 3 -0.55513 Ynav3
Test 3 nav 2 4 0.80623 Ynav4
Test 4 nav 2 4 0.64853 Ynav4
Test 5 nav 2 4 1.08765 Ynav4
Test 6 nav 2 4 1.01301 Ynav4
Test 7 nav 2 4 1.68095 Ynav4
Test 8 nav 2 4 0.75435 Ynav4
Test 9 nav 2 4 1.80136 Ynav4
Test 10 nav 2 4 -0.09632 Ynav4
Test 11 nav 2 4 0.63079 Ynav4
Test 12 nav 2 4 1.10397 Ynav4
Test 13 nav 2 4 -1.00044 Ynav4
Test 3 nav 3 1 0.30002 Znav1
Test 4 nav 3 1 1.28061 Znav1
Test 5 nav 3 1 0.68539 Znav1
Test 6 nav 3 1 1.02858 Znav1
Test 7 nav 3 1 -0.64029 Znav1
Test 8 nav 3 1 0.02846 Znav1
Test 9 nav 3 1 -0.7359 Znav1
Test 10 nav 3 1 1.62957 Znav1
Test 11 nav 3 1 0.6435 Znav1
Test 12 nav 3 1 0.93626 Znav1
Test 13 nav 3 1 1.04747 Znav1
Test 3 nav 3 2 0.57566 Znav2
Test 4 nav 3 2 1.20691 Znav2
Test 5 nav 3 2 1.40799 Znav2
Test 6 nav 3 2 1.11201 Znav2
Test 7 nav 3 2 0.75934 Znav2
Test 8 nav 3 2 -0.22987 Znav2
Test 9 nav 3 2 1.75432 Znav2
Test 10 nav 3 2 -0.6516 Znav2
Test 11 nav 3 2 1.34231 Znav2
Test 12 nav 3 2 0.90117 Znav2
Test 13 nav 3 2 0.11162 Znav2
Test 3 nav 3 3 0.58588 Znav3
Test 4 nav 3 3 1.0121 Znav3
Test 5 nav 3 3 1.43547 Znav3
Test 6 nav 3 3 0.85504 Znav3
Test 7 nav 3 3 1.44643 Znav3
Test 8 nav 3 3 1.16255 Znav3
Test 9 nav 3 3 0.53063 Znav3
Test 10 nav 3 3 -0.78273 Znav3
Test 11 nav 3 3 0.25154 Znav3
Test 12 nav 3 3 0.92297 Znav3
Test 13 nav 3 3 1.73149 Znav3
Test 3 nav 3 4 0.819 Znav4
Test 4 nav 3 4 0.99785 Znav4
Test 5 nav 3 4 1.69843 Znav4
Test 6 nav 3 4 1.16722 Znav4
Test 7 nav 3 4 -1.79985 Znav4
Test 8 nav 3 4 -1.09761 Znav4
Test 9 nav 3 4 -2.18542 Znav4
Test 10 nav 3 4 -0.64241 Znav4
Test 11 nav 3 4 2.36162 Znav4
Test 12 nav 3 4 0.87591 Znav4
Test 13 nav 3 4 0.12302 Znav4
;
run;
title2 "Individual Peptide Figures";
pattern1 color=blue;
pattern2 color=grayCC;
axis1 label=(f="Arial/Bold" "Standardized Intensity");
axis2 label=none;
axis3 label=none value=none;
/* -------------------------------------------------------*/
title1 /*height=1*/ "Test";
proc gchart data=show_problem;
where Gene_ID = "Test";
hbar id /
type=sum
sumvar=intensity
group=cat
patternID=group
NOZERO
legend=legend1
nostats
raxis=axis1
maxis=axis2
gaxis=axis3
coutline=black
woutline=1;
run;
quit;
---------------------
Here is the output that I get.
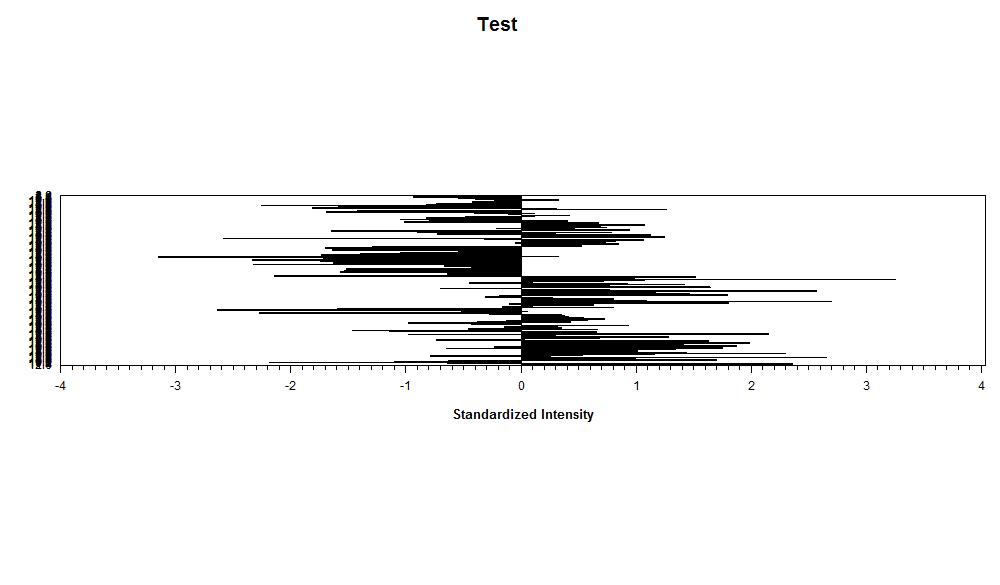
If I could stretch the output vertically it would all fit, and look great!hbar

- Mark as New
- Bookmark
- Subscribe
- Mute
- RSS Feed
- Permalink
- Report Inappropriate Content
I guess the question is ... "What would you like the graph to look like?" ![]()
Your code is trying to plot so many things (and therefore so many bars) in 1 graph, that it is 'squishing' them all together.
If you plot it 'by cat' (separate graph for each cat), rather than using cat as the 'group' variable, then you will get a several separate graphs, rather than having it all squeezed into 1 ... but I'm not sure if that's what you're wanting.
proc sort data=show_problem;
by cat;
run;
proc gchart data=show_problem;
where Gene_ID = "Test";
by cat;
hbar id /
type=sum
sumvar=intensity
legend=legend1
nostats
raxis=axis1
maxis=axis2
coutline=black
woutline=1;
run;
- Mark as New
- Bookmark
- Subscribe
- Mute
- RSS Feed
- Permalink
- Report Inappropriate Content
Hello and sorry for being unclear. Unfortunately for this application I need each CAT shown side-by-side in an image that can be as long as it needs to be to show all the categories. If I could get the hbar to fill the entire frame (notice the white space above and below the chart on the image), then I could simply lengthen the output size of the image until everything fit, and was legible. Does that help clarify more problem?
Thanks for the consideration,
Rich
- Mark as New
- Bookmark
- Subscribe
- Mute
- RSS Feed
- Permalink
- Report Inappropriate Content
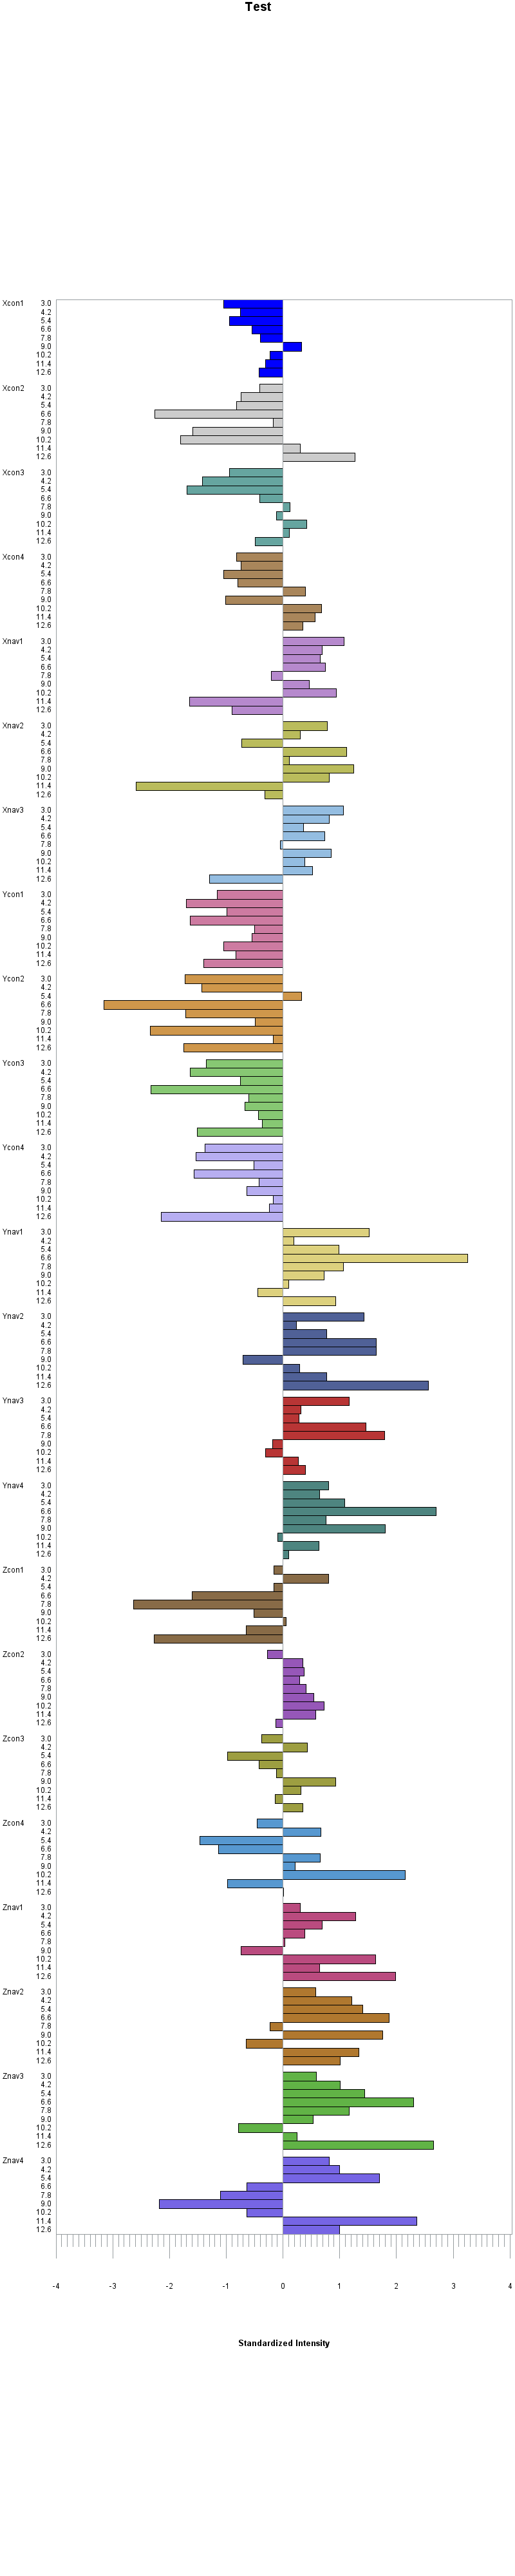
Ahh - ok...
If you want the graph to be vary large (tall), you can set the ypixels to a large value, and then experiment with the width (bar width), space (space between bars) and gspace (space between groups) until you get values where SAS does not complain about overlapping (in the log).
But with extremely tall sas/graphs, there is typically a lot of space wasted at the top & bottom of the graph. (Perhaps someone other than me knows a 'trick' around this?)
axis1 label=(f="Arial/Bold" "Standardized Intensity");
axis2 label=none;
axis3 label=none;
title1 "Test";
goptions ypixels=4000;
proc gchart data=show_problem;
where Gene_ID = "Test";
hbar id /
type=sum
sumvar=intensity
group=cat
patternid=group
NOZERO
legend=legend1
nostats
raxis=axis1
maxis=axis2
gaxis=axis3
space=0
gspace=.15
width=.18
coutline=black
;
run;
.jpg")
Catch up on SAS Innovate 2026
Nearly 200 sessions are now available on demand in the Innovate Hub.
Watch Now →Learn how use the CAT functions in SAS to join values from multiple variables into a single value.

Find more tutorials on the SAS Users YouTube channel.
SAS Training: Just a Click Away
Ready to level-up your skills? Choose your own adventure.
-
3 replies
-
10-20-2013 04:42 PM
-
2426 views
-
0 likes
-
2 in conversation
-
