- Home
- /
- Programming
- /
- Graphics
- /
- converting a num var to a SAS date field
- RSS Feed
- Mark Topic as New
- Mark Topic as Read
- Float this Topic for Current User
- Bookmark
- Subscribe
- Mute
- Printer Friendly Page
- Mark as New
- Bookmark
- Subscribe
- Mute
- RSS Feed
- Permalink
- Report Inappropriate Content
Hello all-
I have a "month" field that stores the values (5 digits) as a number vs a SAS date value. I can still use formats as such as mmddyy10. and it works fine except when I need to use it in a SG template and then I get an error for what I need to do. Any help much appreciated.
How can I convert this over to an actual date value per se.
Thanks
Lawrence
- Mark as New
- Bookmark
- Subscribe
- Mute
- RSS Feed
- Permalink
- Report Inappropriate Content
Generally you still need SAS dates no matter what procedure.
Can you provide more information? Is the SG Template custom designed (SG Render) or from a specific proc. Can you modify the template?
And what's your errror?
- Mark as New
- Bookmark
- Subscribe
- Mute
- RSS Feed
- Permalink
- Report Inappropriate Content
Reeza;
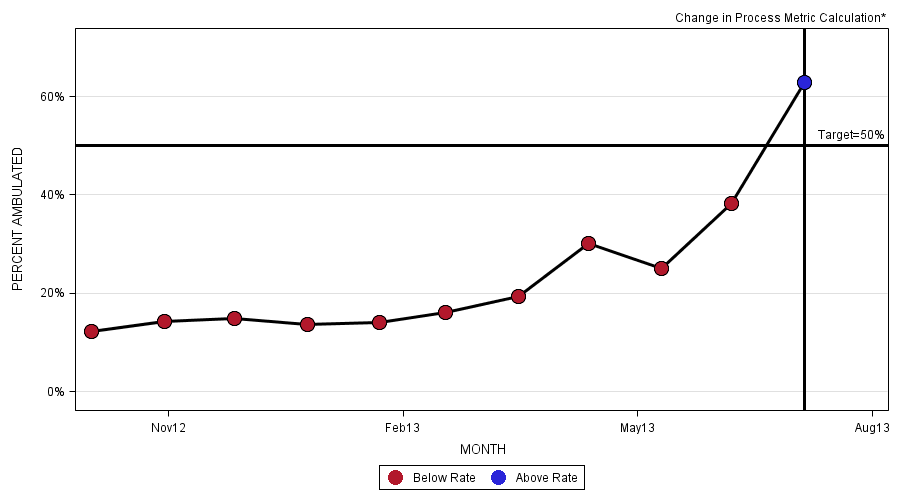
My partial template is as follows below. The problem is that I am using the interval option=month in the xaxisopts as I want all the monthly values displayed. And this works until I stick in the x reference line and then kablu-ee-
The tick dates now go quarterly and the referent line no longer syncs with Aug13 but is staggered. It should be sitting right on the dateline.
You can see the issue in the first image.
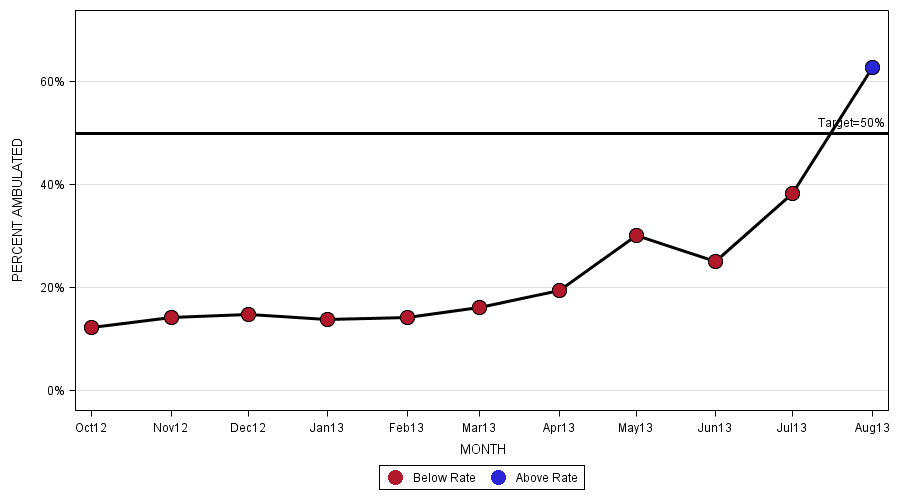
The second image has all the date ticks sans referent line.
the message I get is:
NOTE: Time axis can only support date time values. The axis type will be changed to LINEAR.
So does this mean that it needs a datetime value such as 01SEP13:00:00:00?
All my dates are stored as datew.
Thank you for your time.
Lawrence
define statgraph BarLineMOB; /*CREATES TEMPLATE FOR HAP MOBILTY RATE GRAPHS FOR EACH FACILITY*/
begingraph;
layout overlay / xaxisopts=(timeopts=( tickvalueformat=monyy. splittickvalue=false /*viewmin='01OCT12'D viewmax='01AUG13'D */interval=month))
yaxisopts=(LABEL=('PERCENT AMBULATED') offsetmin=0.05 offsetmax=0.05 griddisplay=on linearopts=( viewmin=0 viewmax=.7)) ;
referenceline y=.5 /lineattrs=graphdatadefault(thickness=3 color=black) CURVElabel='Target=50%' CURVELABELPOSITION=auto Curvelabellocation=inside;
referenceline x=19571/lineattrs=graphdatadefault(thickness=3 color=black) CURVElabel='Change in Process Metric Calculation* ' /*CURVELABELPOSITION=auto Curvelabellocation=inside*/;
seriesplot x=month y=PCT_COMPLIANCE / lineattrs=graphdatadefault(thickness=3 color=black) name="PERCENT AMBULATED" LEGENDLABEL="PERCENT AMBULATED" ;
scatterplot x=month y=PCT_COMPLIANCE / GROUP=grp_color index=index includemissinggroup=false markerattrs=(symbol=circlefilled size=15) name="Status" LEGENDLABEL="Status";
scatterplot x=month y=PCT_COMPLIANCE /includemissinggroup=false markerattrs=(symbol=circle size=16 color=black) ;
*scatterplot x=month y=PCT_COMPLIANCE / GROUP=grp_color index=index1 discreteoffset= -0.1 includemissinggroup=false markercharacter=PCT_COMPLIANCE markercharacterattrs=(/*color=white*/ weight=bold );
discretelegend /*"HAP RATE PER 1000 ADMITS"*/ "Status" /
location=outside valign=bottom;
endlayout;
endgraph;
end;
end;
This image happens when I add the referent line-date marks go quarterly.

All date ticks appear

- Mark as New
- Bookmark
- Subscribe
- Mute
- RSS Feed
- Permalink
- Report Inappropriate Content
It looks like you want a datetime variable
dt = dhms(date,0,0,0);
would create a new variable for midnight(start of day);
- Mark as New
- Bookmark
- Subscribe
- Mute
- RSS Feed
- Permalink
- Report Inappropriate Content
Ballrdw;
Well, it didn't like that either...Although that is what I though SAS wanted as well.
Lawrence
- Mark as New
- Bookmark
- Subscribe
- Mute
- RSS Feed
- Permalink
- Report Inappropriate Content
What version of SAS are you on? SG options change
Did you use SG Designer to get the code or write it yourself?
Can you provide some data and I'll test it out on my side (have sas 9.3)
- Mark as New
- Bookmark
- Subscribe
- Mute
- RSS Feed
- Permalink
- Report Inappropriate Content
Reeza;
OK bit by bit I am figuring this out-
In short the reference line must be in exactly the same format as the underlying data-
So if the dates are in format monyy5. in the dataset but I add a referent line as such as x= '01AUG13'D it fails to work properly-
So the question is how do I list the date
X=AUG13? in the same format
I have temporarily solved the problem by using the SAS dates (eg 19571 for AUG 1 2013)
and then using the dynamic function to make sure I list all the dates in the sgrender statement
but specifying the option to using monyy5 in the xaxisopts=(linearopts=( tickvalueformat=monyy5.))
Hopefully by being able to put the date format the right way it will solve another step of creating a macro variable for the purposes of listing all the dates but a viable option if necessary.
Lawrence
- Mark as New
- Bookmark
- Subscribe
- Mute
- RSS Feed
- Permalink
- Report Inappropriate Content
Repost this in the graphics forum, one of the SAS guys will be able to help.
Make sure to say what version of SAS you're using.
- Mark as New
- Bookmark
- Subscribe
- Mute
- RSS Feed
- Permalink
- Report Inappropriate Content
Reeza;
I just moved the whole thread over.
Many thanks.
Lawrence
Learn how use the CAT functions in SAS to join values from multiple variables into a single value.
Find more tutorials on the SAS Users YouTube channel.
SAS Training: Just a Click Away
Ready to level-up your skills? Choose your own adventure.


