- Home
- /
- Programming
- /
- Graphics
- /
- box plot code
- RSS Feed
- Mark Topic as New
- Mark Topic as Read
- Float this Topic for Current User
- Bookmark
- Subscribe
- Mute
- Printer Friendly Page
- Mark as New
- Bookmark
- Subscribe
- Mute
- RSS Feed
- Permalink
- Report Inappropriate Content
I need a SAS code for a simple box plot for a dummy variable female and male versus salary
Could you please help me with that
- Mark as New
- Bookmark
- Subscribe
- Mute
- RSS Feed
- Permalink
- Report Inappropriate Content
I need a SAS code for a simple box plot for a dummy variable female and male versus salary
Could you please help me with that
- Mark as New
- Bookmark
- Subscribe
- Mute
- RSS Feed
- Permalink
- Report Inappropriate Content
@RW9 just did 🙂
- Mark as New
- Bookmark
- Subscribe
- Mute
- RSS Feed
- Permalink
- Report Inappropriate Content
Hello @shahd,
Your question requires more details before experts can help. Can you revise your question to include more information?
Review this checklist:
- Specify a meaningful subject line for your topic. Avoid generic subjects like "need help," "SAS query," or "urgent."
- When appropriate, provide sample data in text or DATA step format. See this article for one method you can use.
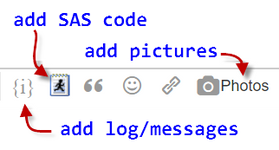
- If you're encountering an error in SAS, include the SAS log or a screenshot of the error condition. Use the Photos button to include the image in your message.
- It also helps to include an example (table or picture) of the result that you're trying to achieve.
To edit your original message, select the "blue gear" icon at the top of the message and select Edit Message. From there you can adjust the title and add more details to the body of the message. Or, simply reply to this message with any additional information you can supply.
SAS experts are eager to help -- help them by providing as much detail as you can.
This prewritten response was triggered for you by fellow SAS Support Communities member @Kurt_Bremser
.- Mark as New
- Bookmark
- Subscribe
- Mute
- RSS Feed
- Permalink
- Report Inappropriate Content
I just did a quick google:
And there are several examples in the manual:
https://support.sas.com/documentation/cdl/en/statug/63347/HTML/default/viewer.htm#boxplot_toc.htm
And finally this is a great resource for any graphing questions, gives example code of almost any graph you can think of:
- Mark as New
- Bookmark
- Subscribe
- Mute
- RSS Feed
- Permalink
- Report Inappropriate Content
Please note that I've merged your two posts into one and moved them to the graphics forum.
@shahd wrote:
I need a SAS code for a simple box plot for a dummy variable female and male versus salary
Could you please help me with that
Learn how use the CAT functions in SAS to join values from multiple variables into a single value.
Find more tutorials on the SAS Users YouTube channel.
SAS Training: Just a Click Away
Ready to level-up your skills? Choose your own adventure.


