- Home
- /
- Programming
- /
- Graphics
- /
- Why does the second symbol statement not have the effect?
- RSS Feed
- Mark Topic as New
- Mark Topic as Read
- Float this Topic for Current User
- Bookmark
- Subscribe
- Mute
- Printer Friendly Page

- Mark as New
- Bookmark
- Subscribe
- Mute
- RSS Feed
- Permalink
- Report Inappropriate Content
Hi all,
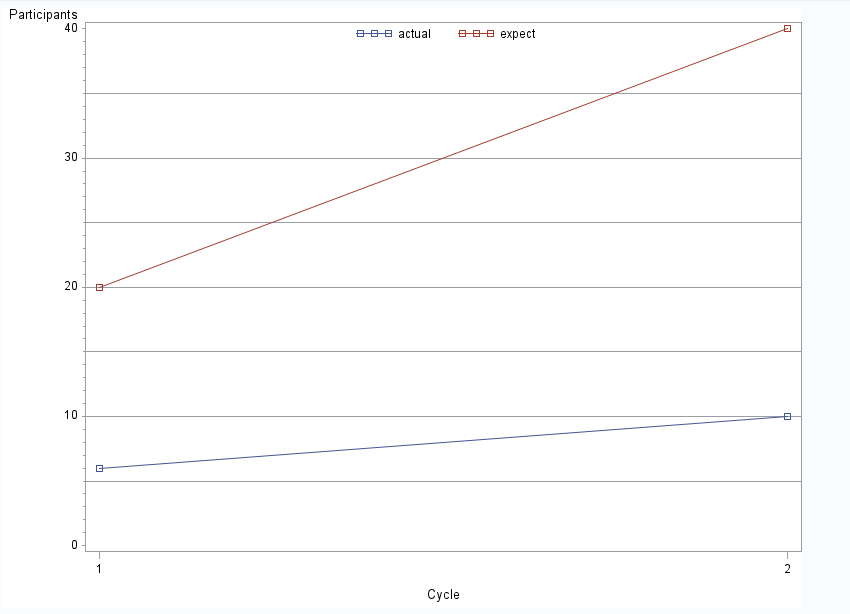
I just want to create an overlay plot. I defined the first plot symbol as square and the second one as dot, however the result shows both of them are squares. I attache the code and the plot below. Does any one know why the SYMBOL2 statement does not work? Thank you in advance!
goptions reset=all;
symbol1 interpol=join
value=square;
symbol2 interpol=join
value=dot
;
axis1 order=(1 to 2 by 1) offset=(2,2)
label=("Cycle");
axis2
label=("Participants");
legend1 label=none
position=(top center inside)
mode=share;
proc gplot data=act_exp1;
plot actual*cycle expect*cycle/overlay legend=legend1
vref= 5 to 35 by 5
haxis=axis1
vaxis=axis2;
run;
Kane
Accepted Solutions

- Mark as New
- Bookmark
- Subscribe
- Mute
- RSS Feed
- Permalink
- Report Inappropriate Content
To move the next statement, you have to specify both the color AND the value. However, if you just want to get the color from the ODS style, use "_style_" for the color:
symbol1 interpol=join color=_style_
value=square;
symbol2 interpol=join color=_style_
value=dot
;
Hope this helps!
- Mark as New
- Bookmark
- Subscribe
- Mute
- RSS Feed
- Permalink
- Report Inappropriate Content
It works, thank you very much, Dan.
.jpg")
Catch up on SAS Innovate 2026
Nearly 200 sessions are now available on demand in the Innovate Hub.
Watch Now →Learn how use the CAT functions in SAS to join values from multiple variables into a single value.

Find more tutorials on the SAS Users YouTube channel.
SAS Training: Just a Click Away
Ready to level-up your skills? Choose your own adventure.
-
2 replies
-
06-22-2015 04:21 PM
-
1960 views
-
0 likes
-
2 in conversation
-
