- Home
- /
- Programming
- /
- Graphics
- /
- Re: Stacked, Grouped Bar Chart with Multiple Y2-Axis lines
- RSS Feed
- Mark Topic as New
- Mark Topic as Read
- Float this Topic for Current User
- Bookmark
- Subscribe
- Mute
- Printer Friendly Page
- Mark as New
- Bookmark
- Subscribe
- Mute
- RSS Feed
- Permalink
- Report Inappropriate Content
Hi All,
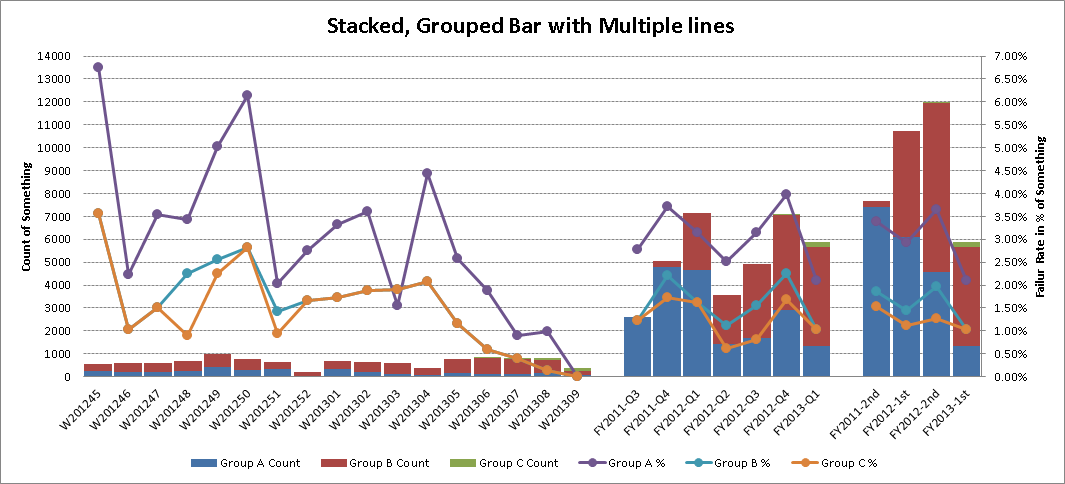
Is it possible to re-create this chart in SAS. It was made in Excel. I need to incorporate drill down and some other things but can't do it in Excel. I have looked around in the docs, but did not see anything like this. Oh by the way need the spaces between groups. The groupa are from left to right: weeks, quarters, half years. I appreciate the help. I am running SAS 9.2 on windows.
Thanks.

Accepted Solutions
- Mark as New
- Bookmark
- Subscribe
- Mute
- RSS Feed
- Permalink
- Report Inappropriate Content
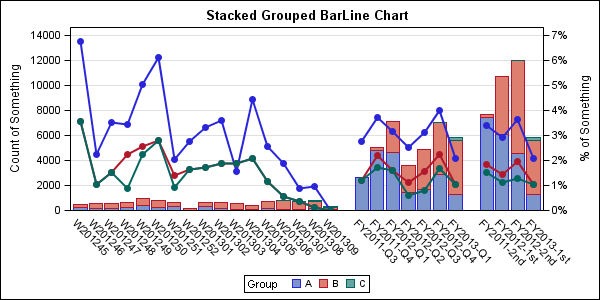
Here is your graph using SAS 9.2 SGPLOT procedure.

SAS 9.2 SGPLOT Code is straightforward:
ods html;
ods graphics / reset imagemap=on;
title 'Stacked Grouped BarLine Chart';
proc sgplot data=groupedData;
format xaxis $xaxis. linevalue percent.;
vbar xaxis / response=BarValue group=Group missing url=url;
vline xaxis / response=LineValue group=Group missing y2axis break markers
markerattrs=(symbol=circlefilled size=5) lineattrs=(pattern=solid);
xaxis display=(noticks nolabel) discreteorder=data;
yaxis offsetmin=0 values=(0 to 14000 by 2000) grid;
y2axis offsetmin=0 values=(0 to 0.07 by 0.01);
run;
ods html close;
The key is how to create the blank spaces between the groups. Using a missing value or blank works if you have only one. With two, they get combined into one value on the x axis. So, I replaced the two missing values in your spreadsheet with the strings "Miss1" and "Miss2". You can use any distinct strings.
Then, I created a format and formatted each of these strings to a unique invisible string using the non-breaking space 'A0'x. This space does not get stripped out, and so I made one with a nbsp on each side of a 10 character string, and another with a third nbsp in the middle.
I also changed your structure from a multi column to a grouped format mainly to get the stacked bar chart. VLINE statement uses BREAK option to break each line at the missing value. Add URL column to data set and set it on the url option.
Message was edited by: Sanjay Matange Files attached.
- Mark as New
- Bookmark
- Subscribe
- Mute
- RSS Feed
- Permalink
- Report Inappropriate Content
I believe this could be made using 9.2 SG or GTL. Can you attach your data?
- Mark as New
- Bookmark
- Subscribe
- Mute
- RSS Feed
- Permalink
- Report Inappropriate Content
Dear
I suppose with many customization you can use this sample provided by SAS :
http://support.sas.com/documentation/cdl/en/graphref/63022/HTML/default/viewer.htm#a003171144.htm
I depend also which SAS tool you use (EG,Add-ins, SAS Foundation, SAS graph, Web Report Studio ) ?
Regards
- Mark as New
- Bookmark
- Subscribe
- Mute
- RSS Feed
- Permalink
- Report Inappropriate Content
Hi lacrefa,
Thanks for the link. I am aware of the vast standard charting capabilities of SAS, and I do not know how to put spaces in the xaxis using gbarline, there is not option for grouping. I am not a new SAS programmer, but SG and GTL I am not familiar with it at all.
Thanks,
CPAZ
- Mark as New
- Bookmark
- Subscribe
- Mute
- RSS Feed
- Permalink
- Report Inappropriate Content
Hi Sanjay@SAS. Thanks. I have attached the data.
Thanks for any help you can provide.
- Mark as New
- Bookmark
- Subscribe
- Mute
- RSS Feed
- Permalink
- Report Inappropriate Content
Here is your graph using SAS 9.2 SGPLOT procedure.

SAS 9.2 SGPLOT Code is straightforward:
ods html;
ods graphics / reset imagemap=on;
title 'Stacked Grouped BarLine Chart';
proc sgplot data=groupedData;
format xaxis $xaxis. linevalue percent.;
vbar xaxis / response=BarValue group=Group missing url=url;
vline xaxis / response=LineValue group=Group missing y2axis break markers
markerattrs=(symbol=circlefilled size=5) lineattrs=(pattern=solid);
xaxis display=(noticks nolabel) discreteorder=data;
yaxis offsetmin=0 values=(0 to 14000 by 2000) grid;
y2axis offsetmin=0 values=(0 to 0.07 by 0.01);
run;
ods html close;
The key is how to create the blank spaces between the groups. Using a missing value or blank works if you have only one. With two, they get combined into one value on the x axis. So, I replaced the two missing values in your spreadsheet with the strings "Miss1" and "Miss2". You can use any distinct strings.
Then, I created a format and formatted each of these strings to a unique invisible string using the non-breaking space 'A0'x. This space does not get stripped out, and so I made one with a nbsp on each side of a 10 character string, and another with a third nbsp in the middle.
I also changed your structure from a multi column to a grouped format mainly to get the stacked bar chart. VLINE statement uses BREAK option to break each line at the missing value. Add URL column to data set and set it on the url option.
Message was edited by: Sanjay Matange Files attached.
- Mark as New
- Bookmark
- Subscribe
- Mute
- RSS Feed
- Permalink
- Report Inappropriate Content
Hi Sanjay,
You need to use the "advanced editor" to attach file. Would you also please attach the sas dataset?
Thanks!
- Mark as New
- Bookmark
- Subscribe
- Mute
- RSS Feed
- Permalink
- Report Inappropriate Content
How do I signify this post has been answered?
- Mark as New
- Bookmark
- Subscribe
- Mute
- RSS Feed
- Permalink
- Report Inappropriate Content
A couple of buttons labelled something like "Useful Reply" and Correct Answer" should appear at the bottom of each new post; all you should then need to do is click the relevant one - but having said that, I'm not seeing them here, and I don't know why not. Can anybody help?
- Mark as New
- Bookmark
- Subscribe
- Mute
- RSS Feed
- Permalink
- Report Inappropriate Content
Hi,
The "helpful answer" and "correct answer" buttons are only available to the Original Poster after login.
- Mark as New
- Bookmark
- Subscribe
- Mute
- RSS Feed
- Permalink
- Report Inappropriate Content
Hello Sunjay,
I did as your instruction. But i strugged on Error transcode as picutre below.
And i try to use another Non-space-breaking but it's not work.
Would you mind to suggest?

- Mark as New
- Bookmark
- Subscribe
- Mute
- RSS Feed
- Permalink
- Report Inappropriate Content
CPAZ;
It's a too busy graph and dual scale graphs are not good dataviz practice. I recommend that you split it into two smaller graphs - one for count and another for percent. Retain the same colours in both graphs for each group to reduce the amount of legend and use fewer tick marks on the axes to reduce the busyness.
- Mark as New
- Bookmark
- Subscribe
- Mute
- RSS Feed
- Permalink
- Report Inappropriate Content
Hi Bill,
Thanks for the reply. Unfortunately separating the graphs is not an option. This kind of graph is commonly used in my company, so the audience is well aware on how to read the graph. It gives them the most amount of information in a single graph.
CPAZ
- Tags:
- Time2Change
April 27 – 30 | Gaylord Texan | Grapevine, Texas
Registration is open
Walk in ready to learn. Walk out ready to deliver. This is the data and AI conference you can't afford to miss.
Register now and save with the early bird rate—just $795!
Learn how use the CAT functions in SAS to join values from multiple variables into a single value.
Find more tutorials on the SAS Users YouTube channel.
SAS Training: Just a Click Away
Ready to level-up your skills? Choose your own adventure.


