- Home
- /
- Programming
- /
- Graphics
- /
- Space between the bars
- RSS Feed
- Mark Topic as New
- Mark Topic as Read
- Float this Topic for Current User
- Bookmark
- Subscribe
- Mute
- Printer Friendly Page

- Mark as New
- Bookmark
- Subscribe
- Mute
- RSS Feed
- Permalink
- Report Inappropriate Content
Hi all
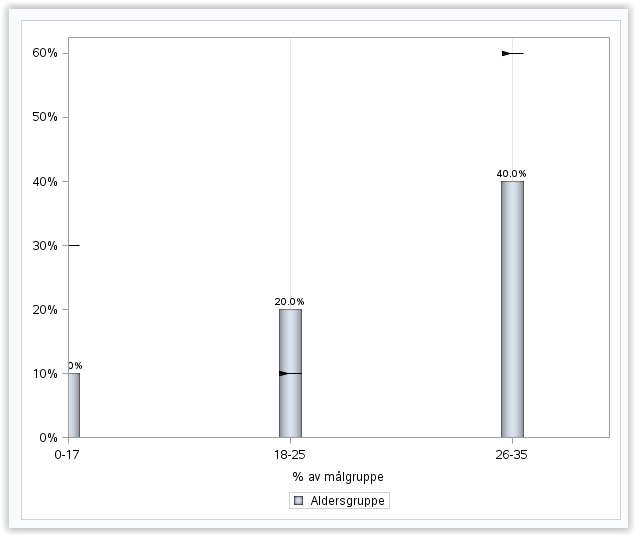
I am not an expert regarding sas graphs but I managed to create a graph based on proc template but I am not there yet. As you can see the picture below I want to move the bar on the left more to the right... I have tried barwidth and ods graphics but it didnt work.
Any suggestions?
Any help is appriciated.
Thanks
best regards
Johan
My code:
data test;
input CU_AGE $ MALGRUPPE REFERANSE;
datalines;
0-17 0.1 0.3
18-25 0.2 0.1
26-35 0.4 0.6
;
proc template;
define statgraph profile_age;
dynamic _NEGATIVE_;
dynamic _ticklist_;
begingraph /;
entrytitle "";
layout overlay / xaxisopts=( griddisplay=on Label="% av målgruppe" offsetmin=0 type=discrete ) yaxisopts=( /*reverse=true*/ display=( ticks tickvalues line ) type=linear ) y2axisopts=(reverse=true);
if (_NEGATIVE_) ReferenceLine x=0 / lineattrs=GraphAxisLines;
endif;
barchart X='CU_AGE'n Y='MALGRUPPE'n / primary=true orient=vertical LegendLabel="Aldersgruppe" NAME="a" dataskin=PRESSED target=REFERANSE barlabel=true barwidth=0.1;
/*ScatterPlot X='TARGET'n Y='CU_GENDER'n / discreteOffset=-0.35 Markerattrs=( Symbol=TRIANGLEDOWNFILLED Size=10) DataTransparency=0.4 LegendLabel="normale population" NAME="t";*/
DiscreteLegend "a" "t" / Location=outside Title="";
endlayout;
endgraph;
end;
run;
ods graphics on / height=500px width=600px;
proc sgrender data=work.test template=profile_age;
format 'MALGRUPPE'n percent12.1;
run;
ods graphics off;
Accepted Solutions

- Mark as New
- Bookmark
- Subscribe
- Mute
- RSS Feed
- Permalink
- Report Inappropriate Content
The OFFSETMIN=0 is what's causing your left bar to clip. either increase the offset (perhaps offsetmin=.05) or just remove the option altogether.
- Mark as New
- Bookmark
- Subscribe
- Mute
- RSS Feed
- Permalink
- Report Inappropriate Content
The OFFSETMIN=0 is what's causing your left bar to clip. either increase the offset (perhaps offsetmin=.05) or just remove the option altogether.
- Mark as New
- Bookmark
- Subscribe
- Mute
- RSS Feed
- Permalink
- Report Inappropriate Content
Thank you very much sir ![]()
.jpg")
Catch up on SAS Innovate 2026
Nearly 200 sessions are now available on demand in the Innovate Hub.
Watch Now →Learn how use the CAT functions in SAS to join values from multiple variables into a single value.

Find more tutorials on the SAS Users YouTube channel.
SAS Training: Just a Click Away
Ready to level-up your skills? Choose your own adventure.
-
2 replies
-
05-07-2015 06:38 AM
-
3021 views
-
0 likes
-
2 in conversation
-
