- Home
- /
- Programming
- /
- Graphics
- /
- Side by Side Histogram
- RSS Feed
- Mark Topic as New
- Mark Topic as Read
- Float this Topic for Current User
- Bookmark
- Subscribe
- Mute
- Printer Friendly Page

- Mark as New
- Bookmark
- Subscribe
- Mute
- RSS Feed
- Permalink
- Report Inappropriate Content
Dear all.
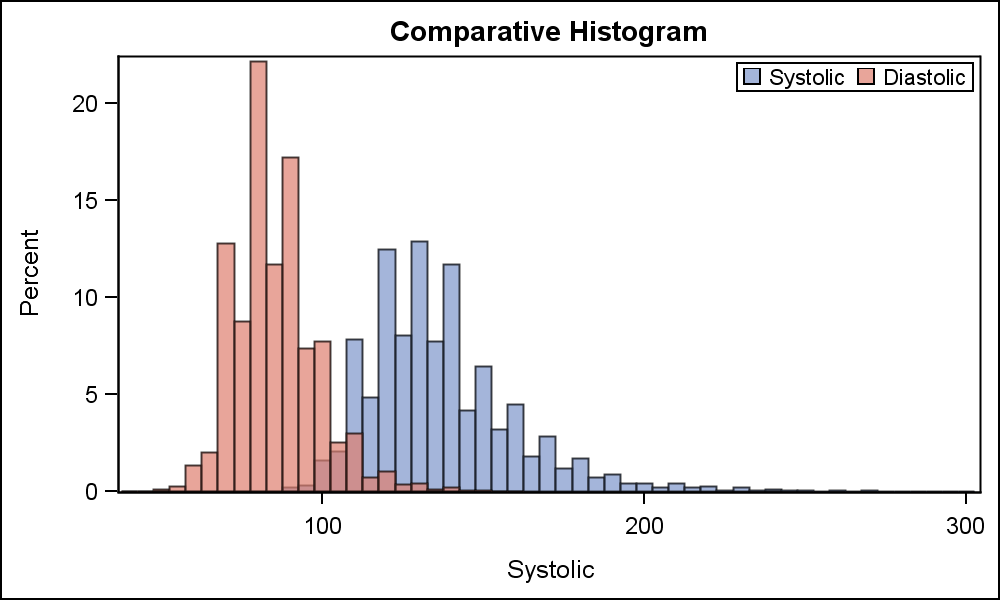
I am trying to create a Side-by-Side histogram, like below.
I can get SAS to ,draw histograms in panels or overlayed but can find no option (something like groupcluster) for a histogram with automatic binning.
Thanks

- Mark as New
- Bookmark
- Subscribe
- Mute
- RSS Feed
- Permalink
- Report Inappropriate Content
I could not see your example. Since Histograms display densities over a continuous range, you cannot have side by side bins like a Bar Chart. However, you can display these as overlays. See this blog article on this topic:
Here is one example:
- Mark as New
- Bookmark
- Subscribe
- Mute
- RSS Feed
- Permalink
- Report Inappropriate Content
Hi Sanjay, I'ts nice to hear from you again (You helped me with a log-scaled graph where the original value was a fraction, but the log scale in SAS cannot handle negative values),
The hisrtogram I'm looking for is standard in SPSS.
Thanks
- Mark as New
- Bookmark
- Subscribe
- Mute
- RSS Feed
- Permalink
- Report Inappropriate Content
Please add a picture of what you want, and the data. Which release of SAS are you using?
- Mark as New
- Bookmark
- Subscribe
- Mute
- RSS Feed
- Permalink
- Report Inappropriate Content
Sorry Sanjay.
I was misinformed by the researcher.
The examples he provided were run in SPSS after coding the bin values.
Thanks for you're patience
.jpg")
Catch up on SAS Innovate 2026
Nearly 200 sessions are now available on demand in the Innovate Hub.
Watch Now →Learn how use the CAT functions in SAS to join values from multiple variables into a single value.

Find more tutorials on the SAS Users YouTube channel.
SAS Training: Just a Click Away
Ready to level-up your skills? Choose your own adventure.
-
4 replies
-
05-30-2015 09:22 AM
-
5289 views
-
0 likes
-
2 in conversation
-
