- Home
- /
- Programming
- /
- Graphics
- /
- Re: SGPANEL: The column format YYMMDDD10 is replaced by an auto-genera...
- RSS Feed
- Mark Topic as New
- Mark Topic as Read
- Float this Topic for Current User
- Bookmark
- Subscribe
- Mute
- Printer Friendly Page

- Mark as New
- Bookmark
- Subscribe
- Mute
- RSS Feed
- Permalink
- Report Inappropriate Content
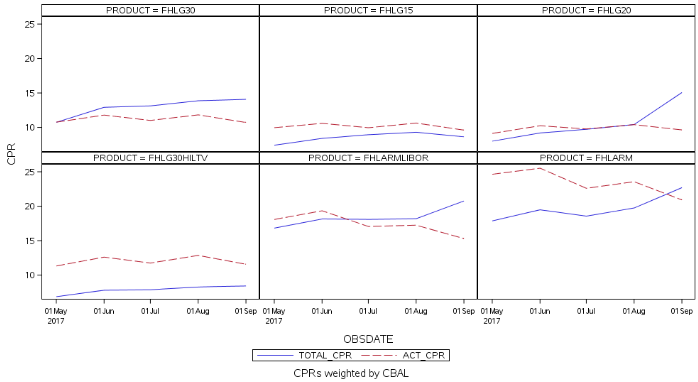
I can't make SGPANEL give me an x axis date format that I want - it only returns e.g., "01May 01Jun 01Jul" etc. I am using 9.4 (TS1M3) on Linux. The PNG file I attached I renamed with a "txt" extension so that this website would accept it - you will have to rename it back to the "PNG" extension to see the SGPANEL chart.
ods graphics / width=1000px height=600px;
footnote1 "CPRs weighted by CBAL";
proc sgpanel data=work.mean_cprs;
where upcase(pool_type_cd) = "FHLMC";
panelby product /sort=data;
colaxis valuesformat=monname1. valueattrs=(size=8) fitpolicy=none;
rowaxis label="CPR";
series x=obsdate y=model_cpr;
series x=obsdate y=act_cpr;
run;
Sample data
Obs POOL_TYPE_CD OBSDATE PRODUCT cpr act_cpr sum_cbal counter
1 FHLMC 2017-05-01 FHLG30 10.7383 10.7609 2.2026287E12 1
2 FHLMC 2017-06-01 FHLG30 12.9237 11.7909 2.2026287E12 1
3 FHLMC 2017-07-01 FHLG30 13.1283 11.0113 2.2026287E12 1
4 FHLMC 2017-08-01 FHLG30 13.8687 11.8219 2.2026287E12 1
5 FHLMC 2017-09-01 FHLG30 14.0827 10.7149 2.2026287E12 1
6 FHLMC 2017-05-01 FHLG15 7.4129 9.9615 480950088183 2
7 FHLMC 2017-06-01 FHLG15 8.4040 10.5897 480950088183 2
8 FHLMC 2017-07-01 FHLG15 8.9393 9.9547 480950088183 2
9 FHLMC 2017-08-01 FHLG15 9.2991 10.6337 480950088183 2
10 FHLMC 2017-09-01 FHLG15 8.6342 9.6043 480950088183 2
11 FHLMC 2017-05-01 FHLG20 8.0025 9.1269 92968164684 3
12 FHLMC 2017-06-01 FHLG20 9.1899 10.2453 92968164684 3
13 FHLMC 2017-07-01 FHLG20 9.7242 9.7772 92968164684 3
14 FHLMC 2017-08-01 FHLG20 10.4183 10.4025 92968164684 3
15 FHLMC 2017-09-01 FHLG20 15.0622 9.6345 92968164684 3
16 FHLMC 2017-05-01 FHLG30HILTV 6.8603 11.3247 60705249917 4
17 FHLMC 2017-06-01 FHLG30HILTV 7.8051 12.6116 60705249917 4
18 FHLMC 2017-07-01 FHLG30HILTV 7.8691 11.7473 60705249917 4
19 FHLMC 2017-08-01 FHLG30HILTV 8.2732 12.8613 60705249917 4
20 FHLMC 2017-09-01 FHLG30HILTV 8.4269 11.5717 60705249917 4
Log Message
NOTE: The column format YYMMDDD10 is replaced by an auto-generated format on the axis.
NOTE: Some of the tick values have been thinned.

Accepted Solutions

- Mark as New
- Bookmark
- Subscribe
- Mute
- RSS Feed
- Permalink
- Report Inappropriate Content
Try this:
ods graphics / width=1000px height=600px;

footnote1 "CPRs weighted by CBAL";
proc sgpanel data=test;
    panelby product /sort=data;
    colaxis valuesformat=monname1. valueattrs=(size=8) fitpolicy=none type=time
          min='01jan2017'd  max='01dec2017'd interval=month;
    rowaxis label="CPR";
    series x=obsdate y=cpr;
    series x=obsdate y=act_cpr ;
run;

Don't forget to give a SAS date format to obsdate.

- Mark as New
- Bookmark
- Subscribe
- Mute
- RSS Feed
- Permalink
- Report Inappropriate Content
Tad confused, are you trying for MONNAME1 -> which would be the first letter of the month?
Or YYMMDD?
- Mark as New
- Bookmark
- Subscribe
- Mute
- RSS Feed
- Permalink
- Report Inappropriate Content
- Mark as New
- Bookmark
- Subscribe
- Mute
- RSS Feed
- Permalink
- Report Inappropriate Content
Yes, good question - I want to see JFMAMJJASOND.
- Mark as New
- Bookmark
- Subscribe
- Mute
- RSS Feed
- Permalink
- Report Inappropriate Content
- Mark as New
- Bookmark
- Subscribe
- Mute
- RSS Feed
- Permalink
- Report Inappropriate Content
Try this:
ods graphics / width=1000px height=600px;

footnote1 "CPRs weighted by CBAL";
proc sgpanel data=test;
    panelby product /sort=data;
    colaxis valuesformat=monname1. valueattrs=(size=8) fitpolicy=none type=time
          min='01jan2017'd  max='01dec2017'd interval=month;
    rowaxis label="CPR";
    series x=obsdate y=cpr;
    series x=obsdate y=act_cpr ;
run;
Don't forget to give a SAS date format to obsdate.
- Mark as New
- Bookmark
- Subscribe
- Mute
- RSS Feed
- Permalink
- Report Inappropriate Content
.jpg")
Catch up on SAS Innovate 2026
Nearly 200 sessions are now available on demand with the SAS Innovate Digital Pass.
Explore Now →Learn how use the CAT functions in SAS to join values from multiple variables into a single value.

Find more tutorials on the SAS Users YouTube channel.
SAS Training: Just a Click Away
Ready to level-up your skills? Choose your own adventure.
-
6 replies
-
11-10-2017 01:29 PM
-
9362 views
-
3 likes
-
3 in conversation
-
