- Home
- /
- Programming
- /
- Graphics
- /
- SGANNO Target Lines on a hbar chart
- RSS Feed
- Mark Topic as New
- Mark Topic as Read
- Float this Topic for Current User
- Bookmark
- Subscribe
- Mute
- Printer Friendly Page

- Mark as New
- Bookmark
- Subscribe
- Mute
- RSS Feed
- Permalink
- Report Inappropriate Content
Hi,
I am having trouble getting vertical lines as targets in the proper place for a hbar chart using sgplot procedure
data looks something like this
| Facility | response | target |
|---|---|---|
| h1 | 26 | 36 |
| h2 | 8 | 18 |
| h3 | 11 | 5 |
| h4 | 112 | 140 |
Graph should look like this or so (with the red lines being the targets)
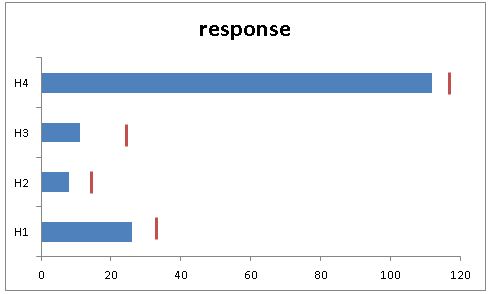
I've seen it done with the regular annotate facility, but haven't been able to get too far with sganno
Thanks for your help.
Bruce

- Mark as New
- Bookmark
- Subscribe
- Mute
- RSS Feed
- Permalink
- Report Inappropriate Content
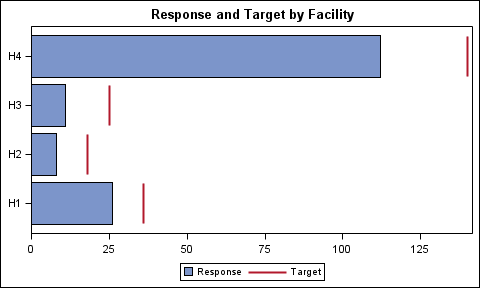
While you can certainly do this with SGAnno, you don't need annotate You can use HBarParm and HiglLow combination to get what you need. You can reduce the bar width if you need. Here is the graph and the code.
data target;
input Facility $ Response Target;
datalines;
H1 26 36
H2 8 18
H3 11 25
H4 112 140
;
run;
title 'Response and Target by Facility';
proc sgplot data=target;
hbarparm category=facility response=response / fillattrs=graphdata1 name='a';
highlow y=facility low=target high=target / lineattrs=graphdata2(thickness=2 pattern=solid)
name='t' legendlabel='Target';
highlow y=facility low=target high=target / type=bar lineattrs=graphdata2(thickness=2 pattern=solid);
xaxis display=(nolabel) offsetmin=0;
yaxis display=(nolabel) reverse;
discretelegend 'a' 't';
run;
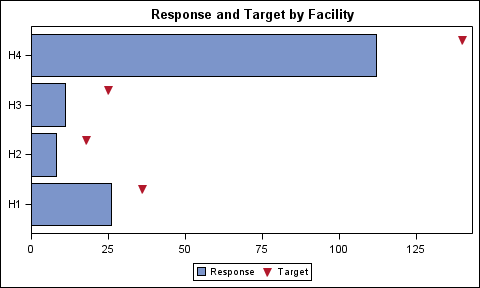
Two HighLow plots are used. One with default Type=Line for the legend. The other with Type=bar for the actual target in the graph. You could use a scatter plot to draw the target for a different look.
title 'Response and Target by Facility';
proc sgplot data=target;
hbarparm category=facility response=response / fillattrs=graphdata1 name='a';
scatter y=facility x=target / markerattrs=graphdata2(symbol=triangledownfilled size=11)
name='t' legendlabel='Target' discreteoffset=0.3;
xaxis display=(nolabel) offsetmin=0;
yaxis display=(nolabel) reverse;
discretelegend 'a' 't';
run;
- Mark as New
- Bookmark
- Subscribe
- Mute
- RSS Feed
- Permalink
- Report Inappropriate Content
Thanks so much. Much easier and serves my purpose well.
Still would like to see the sganno solution as it would come in handy.
Bruce
.jpg")
Catch up on SAS Innovate 2026
Nearly 200 sessions are now available on demand in the Innovate Hub.
Watch Now →Learn how use the CAT functions in SAS to join values from multiple variables into a single value.

Find more tutorials on the SAS Users YouTube channel.
SAS Training: Just a Click Away
Ready to level-up your skills? Choose your own adventure.
-
2 replies
-
01-14-2013 10:23 PM
-
2925 views
-
3 likes
-
2 in conversation
-
