- Home
- /
- Programming
- /
- Graphics
- /
- Re: SAS SGPLOT - Error in COUNT with GROUP option in HISTOGRAM stateme...
- RSS Feed
- Mark Topic as New
- Mark Topic as Read
- Float this Topic for Current User
- Bookmark
- Subscribe
- Mute
- Printer Friendly Page
- Mark as New
- Bookmark
- Subscribe
- Mute
- RSS Feed
- Permalink
- Report Inappropriate Content
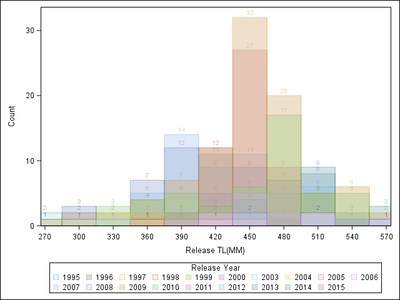
I am using the HISTOGRAM statement in SGPLOT to look at distribution (COUNT) of fish length (TL = total length in mm) grouped by year of release (YEAR). There appears to be a bug when using the GROUP option, as total counts for some of the bins are way off. For example, compare the total count for bin 450. When not grouped, the total count is 97, but when grouped by year, it appears to be just over 30. The bars are not stacking properly by year within bins. The summed count of the 450 bin for grouped data is 83. So it looks like bars are not stacking properly and not all groups are represented in each bin. Can anyone confirm this is a bug or tell me what I've overlooked?
I am running SAS 9.4 (TS1M2) under Windows 7.
The code is below and the CSV data file is attached.
data WORK.RECP15 ;
  infile 'th_r_2015.csv' delimiter = ',' MISSOVER DSD lrecl=32767 firstobs=2 ;
     informat TAG $10. ;
     informat TAG134 $10. ;
     informat Date mmddyy10. ;
     informat HIST $10. ;
     informat STATUS $7. ;
     informat LOCATION $50. ;
     informat COLLECTOR $2. ;
     informat SEX $1. ;
     informat TL best32. ;
     informat WT best32. ;
     informat REARING $50. ;
     informat HEALTH $1. ;
     informat COMMENTS $80. ;
     informat RearC $8.;
     informat RelC $8.;
     format TAG $10. ;
     format TAG134 $10. ;
     format Date mmddyy10. ;
     format HIST $10. ;
     format STATUS $7. ;
     format LOCATION $50. ;
     format COLLECTOR $2. ;
     format SEX $1. ;
     format TL best12. ;
     format WT best12. ;
     format REARING $50. ;
     format HEALTH $1. ;
     format COMMENTS $80. ;
     format RearC $8.;
     format RelC $8.;
    input
     TAG $
     TAG134 $
     Date
     HIST $
     STATUS $
     LOCATION $
     COLLECTOR $
     SEX $
     TL
     WT
     REARING $
     HEALTH $
     COMMENTS $
     RearC $
     RelC $
     ;
     year=year(date);
     yrsout=2015-year;
     qtr=qtr(date);
     month=month(date);
run;

*No groups, y-axis max is at ~100, count is almost 100 for bin of TL=450;
proc sgplot data=recp15;
   histogram tl / scale=count showbins datalabel=count;
   label tl="Release TL(MM)";
run;

*Group by year, count for TL=450 is < 100, y-axis not scaled correctly for total of stacked bar counts;
*Not all years show for TL=450;
proc sgplot data=recp15;
   histogram tl / scale=count group=year binstart=270 binwidth=30 datalabel=count showbins;
   keylegend / location=outside position=bottom sortorder=ascending title="Release Year" ;
   xaxis values=(270 to 570 by 30) ;
   label tl="Release TL(MM)";
run;
Accepted Solutions
- Mark as New
- Bookmark
- Subscribe
- Mute
- RSS Feed
- Permalink
- Report Inappropriate Content
With grouped HISTOGRAM, the groups are layered, not stacked. If you turn on transparency, you will see the layers. You could use a grouped bar chart of frequencies to get the values stacked.
- Mark as New
- Bookmark
- Subscribe
- Mute
- RSS Feed
- Permalink
- Report Inappropriate Content
With grouped HISTOGRAM, the groups are layered, not stacked. If you turn on transparency, you will see the layers. You could use a grouped bar chart of frequencies to get the values stacked.
- Mark as New
- Bookmark
- Subscribe
- Mute
- RSS Feed
- Permalink
- Report Inappropriate Content
Personally, I'm not a fan trying to use a stacked histogram, but you can use PROC UNIVARIATE (OUTHIST= option) to summarize the counts in each bin and then use the VBARPARM statement in PROC SGPLOT to create the plot. It will be ugly when there are many categories.
proc univariate data=sashelp.cars noprint;
class origin;
var mpg_city;
histogram mpg_city / outhist=binout
                     overlay odstitle="Overlay of Histograms";
run;

title "Stack of Histograms";
proc sgplot data=B;
vbarparm category=_midpt_ response=_COUNT_ /
         group=origin groupdisplay=stack barwidth=1;
run;
- Mark as New
- Bookmark
- Subscribe
- Mute
- RSS Feed
- Permalink
- Report Inappropriate Content
Thanks to both of you! There are a lot of categories, so I may just end up using SGPANEL instead.
Learn how use the CAT functions in SAS to join values from multiple variables into a single value.
Find more tutorials on the SAS Users YouTube channel.
SAS Training: Just a Click Away
Ready to level-up your skills? Choose your own adventure.


