- Home
- /
- Programming
- /
- Graphics
- /
- SAS 9.3 GRAPH QUESTION-POLYGON and Line Segment
- RSS Feed
- Mark Topic as New
- Mark Topic as Read
- Float this Topic for Current User
- Bookmark
- Subscribe
- Mute
- Printer Friendly Page
- Mark as New
- Bookmark
- Subscribe
- Mute
- RSS Feed
- Permalink
- Report Inappropriate Content
Hello,everyone,
I want to draw a polygon simulated confidence interval.
My coordinates for (x1,y1) are over 2000,I know it's easy to do that in SAS 9.4 or R,however I only have SAS 9.3,I checked some references,it seems that in sas 9.3 annotation dataset 'POLYGON' (or 'POLYCONT')function only accept numbers input-once for a pair coordinates,is it possible to use variable here?
Moreover would you please give me some hints about how to draw line segment in SAS?
Thank you very much!
- Mark as New
- Bookmark
- Subscribe
- Mute
- RSS Feed
- Permalink
- Report Inappropriate Content
For line segments with SAS 9.3 SGPLOT, you can use either a Vector plot or a Series plot.
- Mark as New
- Bookmark
- Subscribe
- Mute
- RSS Feed
- Permalink
- Report Inappropriate Content
- Mark as New
- Bookmark
- Subscribe
- Mute
- RSS Feed
- Permalink
- Report Inappropriate Content
What statistic are you forming the confidene interval for? Why do you think you want to use a polygon? More details, please!
For a continuous curve, use the BAND statement to display a confidence interval.
For a series of simulated Cis (such as for many simulated CIs for the mean), use the HIGHLOW statement to create a series of confidence intervals.
- Mark as New
- Bookmark
- Subscribe
- Mute
- RSS Feed
- Permalink
- Report Inappropriate Content
Can I do this in SAS?Thank you very much!
- Mark as New
- Bookmark
- Subscribe
- Mute
- RSS Feed
- Permalink
- Report Inappropriate Content
Consistency with R will be much easier with SAS 9.4. For an academic institution, it should be easy to upgrade. You could even use SAS University Edition, which is free, and provides all the SAS 9.4 features, including SGPLOT and GTL.
- Mark as New
- Bookmark
- Subscribe
- Mute
- RSS Feed
- Permalink
- Report Inappropriate Content
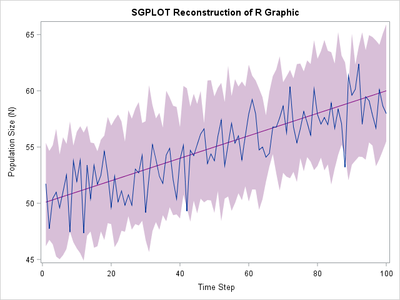
Yes. That plot is easily created by using the BAND statement.
If you are translating from R to SAS, you should realize that not every program has a one-to-one mapping. Every language has conventions that make it unique. In particular, when you see the polygon() call in R, that does not necessarily mean that you should use the POLYGON statement in PROC SGPLOT.
PS: As a former professor myself, I predict that your professor would be thrilled to explain more about the plot and what it shows! Professors love it when students ask questions!
- Mark as New
- Bookmark
- Subscribe
- Mute
- RSS Feed
- Permalink
- Report Inappropriate Content
Here it is:
- Mark as New
- Bookmark
- Subscribe
- Mute
- RSS Feed
- Permalink
- Report Inappropriate Content
Here is the SAS program that generates the graph:
data CI;
call streaminit(12345);
do x = 1 to 100;
   Exp = 50 + x*0.1;
   ConHigh = Exp + 5 + rand("normal");
   ConLow = Exp - 5 + rand("normal");
   OneRun = Exp + rand("Normal",0,2);
   output;
end;
run;

title "SGPLOT Reconstruction of R Graphic";
proc sgplot data=CI noautolegend;
band x=x lower=ConLow upper=ConHigh / fillattrs=(color=thistle);
series x=x y=Exp / lineattrs=(color="purple");
series x=x y=OneRun;
xaxis label="Time Step";
yaxis label="Population Size (N)";
run;
- Mark as New
- Bookmark
- Subscribe
- Mute
- RSS Feed
- Permalink
- Report Inappropriate Content
Learn how use the CAT functions in SAS to join values from multiple variables into a single value.
Find more tutorials on the SAS Users YouTube channel.
SAS Training: Just a Click Away
Ready to level-up your skills? Choose your own adventure.


