- Home
- /
- Programming
- /
- Graphics
- /
- SAS 9.1 proc gplot
- RSS Feed
- Mark Topic as New
- Mark Topic as Read
- Float this Topic for Current User
- Bookmark
- Subscribe
- Mute
- Printer Friendly Page

- Mark as New
- Bookmark
- Subscribe
- Mute
- RSS Feed
- Permalink
- Report Inappropriate Content
Hi to all
Can someone help with this?
My problem is in proc gplot and plot column "operations"
As you can see from example below every time I must manually add value for plot (a*week=2 b*week=3 ....)
For example if value a is missing, in some period of time, I must rewrite it with existing otherwise SAS will show an error.
Is there any solution to avoid manual intervention for every output?
Thank you in advance
Bob
data test;
length operation $1;
format percent percentn10.2;
input week operation percent sum_week;
datalines;
18 a 0.21 5842
18 b 0.34 5842
18 c 0.13 5842
18 d 0.15 5842
18 e 0.02 5842
18 f 0.11 5842
19 a 0.11 8501
19 b 0.14 8501
19 c 0.23 8501
19 d 0.25 8501
19 e 0.32 8501
19 f 0.21 8501
20 a 0.21 7007
20 b 0.34 7007
20 c 0.13 7007
20 d 0.15 7007
20 e 0.02 7007
20 f 0.11 7007
;
run;
proc sort data=test (drop=sum_week) out=test1;
by week;
run;
proc transpose data=test1 out=test1 (drop=_name_);
by week;
id operation;
run;
proc sql;
create table test2 as
select unique week, sum_week
from test;
create table test_final as
select unique test1.*, test2.sum_week
from test1 left join test2
on test1.week=test2.week;
quit; run;
axis1 label=('Lines') order=(0 to .40 by .05) minor=none offset=(0,0);
axis2 label=none minor=none offset=(15,15);
axis3 label=('Bars') order=(0 to 9000 by 1000) minor=none offset=(0,0);
symbol1 value=none interpol=needle width=25 color=cx4573a7 repeat=1;
symbol2 value=none interpol=join repeat=1 color=blue;
symbol3 value=none interpol=join repeat=1 color=cx00ff00;
symbol4 value=none interpol=join repeat=1 color=pink;
symbol5 value=none interpol=join repeat=1 color=red;
symbol6 value=none interpol=join repeat=1 color=purple;
symbol7 value=none interpol=join repeat=1 color=black;
legend1 position=(bottom center) down=1 label=none;
proc gplot data=test_final;
format a percent7.0;
plot a*week=2 b*week=3 c*week=4 d*week=5 e*week=6 f*week=7 / overlay
vaxis=axis1 haxis=axis2 legend=l1gend1;
plot2 sum_week*week=1 / vaxis=axis3 haxis=axis2;
run;
Accepted Solutions

- Mark as New
- Bookmark
- Subscribe
- Mute
- RSS Feed
- Permalink
- Report Inappropriate Content
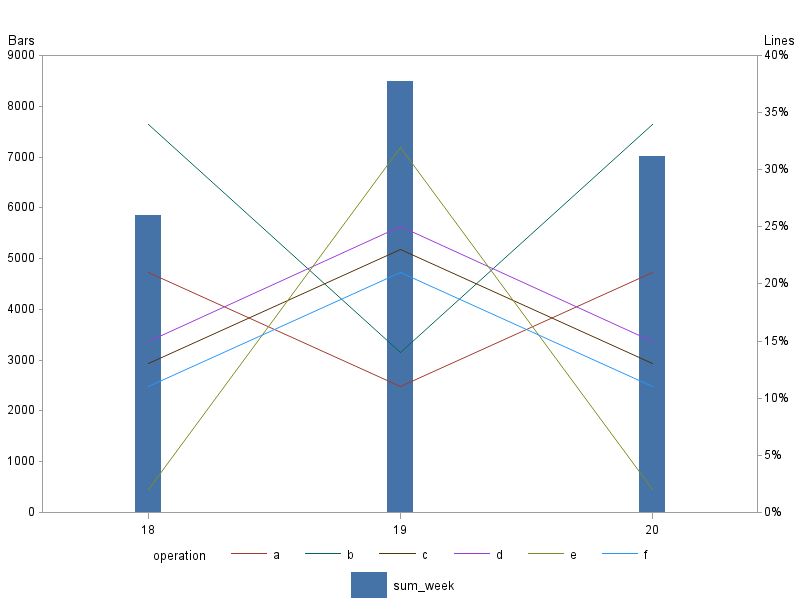
What about something like this?...
data test;
length operation $1;
format percent percentn10.2;
input week operation percent sum_week;
datalines;
18 a 0.21 5842
18 b 0.34 5842
18 c 0.13 5842
18 d 0.15 5842
18 e 0.02 5842
18 f 0.11 5842
19 a 0.11 8501
19 b 0.14 8501
19 c 0.23 8501
19 d 0.25 8501
19 e 0.32 8501
19 f 0.21 8501
20 a 0.21 7007
20 b 0.34 7007
20 c 0.13 7007
20 d 0.15 7007
20 e 0.02 7007
20 f 0.11 7007
;
run;
axis1 label=('Lines') order=(0 to .40 by .05) minor=none offset=(0,0);
axis2 label=none minor=none offset=(15,15);
axis3 label=('Bars') order=(0 to 9000 by 1000) minor=none offset=(0,0);
goptions reset=symbol;
symbol1 value=none interpol=needle width=25 color=cx4573a7 repeat=1;
symbol2 value=none interpol=join;
legend1 position=(bottom center) down=1 label=none;
proc gplot data=test;
format percent percentn7.0;
plot sum_week*week=1 / vaxis=axis3 haxis=axis2 legend=legend1;
plot2 percent*week=operation / vaxis=axis1;
run;
- Mark as New
- Bookmark
- Subscribe
- Mute
- RSS Feed
- Permalink
- Report Inappropriate Content
Robert thank you very much.
Working like a charm.
Bob
.jpg")
Catch up on SAS Innovate 2026
Nearly 200 sessions are now available on demand in the Innovate Hub.
Watch Now →Learn how use the CAT functions in SAS to join values from multiple variables into a single value.

Find more tutorials on the SAS Users YouTube channel.
SAS Training: Just a Click Away
Ready to level-up your skills? Choose your own adventure.
-
2 replies
-
04-23-2014 05:49 AM
-
3139 views
-
0 likes
-
2 in conversation
-
