- Home
- /
- Programming
- /
- Graphics
- /
- Rotate datalabels with GTL
- RSS Feed
- Mark Topic as New
- Mark Topic as Read
- Float this Topic for Current User
- Bookmark
- Subscribe
- Mute
- Printer Friendly Page
- Mark as New
- Bookmark
- Subscribe
- Mute
- RSS Feed
- Permalink
- Report Inappropriate Content
Hi Folks-
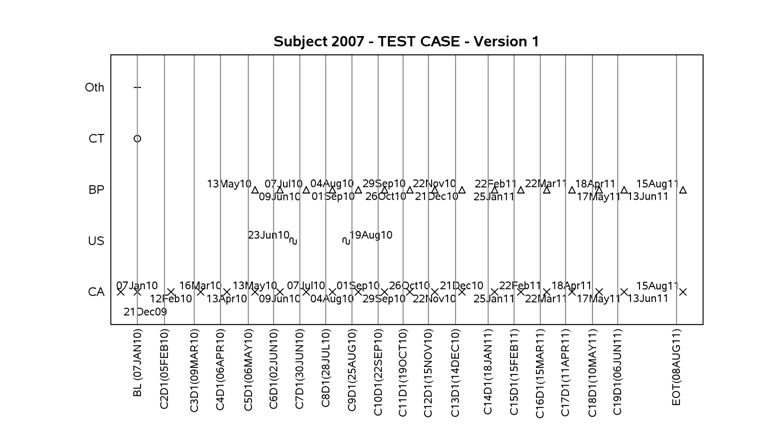
I'm trying to rotate my datalabels 90 degrees on a scatter plot which seems like an easy issue but I can't figure it out. I tried adding a rotate=90 to DATALABELATTRS= but it didn't work. Here's my code and graph. I'm trying to get all those date labels on the plot to appear vertically like the labels for the reference lines do. Can I do it? I'm running 9.2 (TS2M2) on UNIX.

proc template;
define statgraph sgplot;
begingraph;
EntryTitle "Subject 2007 - TEST CASE - Version 2" /;
layout overlay / xaxisopts=( display=none Label=" " type=linear linearopts=( viewmin=-20 viewmax=600 ) ) yaxisopts=( display=(tickvalues line ) Label="Modality" type=linear linearopts=( viewmin=0.5 viewmax=6.5 Integer=true) tickvalueattrs=(size=7) );
ScatterPlot X=x Y=y / primary=true Group=modality DataLabel=asmtdt datalabelattrs=(size=7) LegendLabel=" " NAME="SCATTER";
;
ReferenceLine x=1 / clip=true CURVELABEL="BL (07JAN10)" CurveLabelLocation=Outside CurveLabelPosition=Min curvelabelattrs=(size=7);
ReferenceLine x=30 / clip=true CURVELABEL="C2D1(05FEB10)" CurveLabelLocation=Outside CurveLabelPosition=Min curvelabelattrs=(size=7);
ReferenceLine x=62 / clip=true CURVELABEL="C3D1(09MAR10)" CurveLabelLocation=Outside CurveLabelPosition=Min curvelabelattrs=(size=7);
ReferenceLine x=90 / clip=true CURVELABEL="C4D1(06APR10)" CurveLabelLocation=Outside CurveLabelPosition=Min curvelabelattrs=(size=7);
ReferenceLine x=120 / clip=true CURVELABEL="C5D1(06MAY10)" CurveLabelLocation=Outside CurveLabelPosition=Min curvelabelattrs=(size=7);
ReferenceLine x=147 / clip=true CURVELABEL="C6D1(02JUN10)" CurveLabelLocation=Outside CurveLabelPosition=Min curvelabelattrs=(size=7);
ReferenceLine x=175 / clip=true CURVELABEL="C7D1(30JUN10)" CurveLabelLocation=Outside CurveLabelPosition=Min curvelabelattrs=(size=7);
ReferenceLine x=203 / clip=true CURVELABEL="C8D1(28JUL10)" CurveLabelLocation=Outside CurveLabelPosition=Min curvelabelattrs=(size=7);
ReferenceLine x=231 / clip=true CURVELABEL="C9D1(25AUG10)" CurveLabelLocation=Outside CurveLabelPosition=Min curvelabelattrs=(size=7);
ReferenceLine x=259 / clip=true CURVELABEL="C10D1(22SEP10)" CurveLabelLocation=Outside CurveLabelPosition=Min curvelabelattrs=(size=7);
ReferenceLine x=286 / clip=true CURVELABEL="C11D1(19OCT10)" CurveLabelLocation=Outside CurveLabelPosition=Min curvelabelattrs=(size=7);
ReferenceLine x=313 / clip=true CURVELABEL="C12D1(15NOV10)" CurveLabelLocation=Outside CurveLabelPosition=Min curvelabelattrs=(size=7);
ReferenceLine x=342 / clip=true CURVELABEL="C13D1(14DEC10)" CurveLabelLocation=Outside CurveLabelPosition=Min curvelabelattrs=(size=7);
ReferenceLine x=377 / clip=true CURVELABEL="C14D1(18JAN11)" CurveLabelLocation=Outside CurveLabelPosition=Min curvelabelattrs=(size=7);
ReferenceLine x=405 / clip=true CURVELABEL="C15D1(15FEB11)" CurveLabelLocation=Outside CurveLabelPosition=Min curvelabelattrs=(size=7);
ReferenceLine x=433 / clip=true CURVELABEL="C16D1(15MAR11)" CurveLabelLocation=Outside CurveLabelPosition=Min curvelabelattrs=(size=7);
ReferenceLine x=460 / clip=true CURVELABEL="C17D1(11APR11)" CurveLabelLocation=Outside CurveLabelPosition=Min curvelabelattrs=(size=7);
ReferenceLine x=489 / clip=true CURVELABEL="C18D1(10MAY11)" CurveLabelLocation=Outside CurveLabelPosition=Min curvelabelattrs=(size=7);
ReferenceLine x=516 / clip=true CURVELABEL="C19D1(06JUN11)" CurveLabelLocation=Outside CurveLabelPosition=Min curvelabelattrs=(size=7);
ReferenceLine x=579 / clip=true CURVELABEL="EOT(08AUG11)" CurveLabelLocation=Outside CurveLabelPosition=Min curvelabelattrs=(size=7);
DiscreteLegend "SCATTER"/ title="Modality";
endlayout;
EntryFootnote halign=left "CA=Clinical Assessment, US=Ultrasound, BP=Biopsy" /;
EntryFootnote halign=left "Baseline date is the first dose date (first dosing date with dose information available)." /;
EntryFootnote halign=left "Cycle X day 1 (EOT) date is the corresponding date from vital sign page." /;
endgraph;
end;
run;
Accepted Solutions
- Mark as New
- Bookmark
- Subscribe
- Mute
- RSS Feed
- Permalink
- Report Inappropriate Content
I cannot think of any way to have 90 degree rotated datalabels or tickvalues with SAS 9.2 SG Procedures or GTL. You can get 45 degree rotated tick values automatically. With SAS 9.3 SG annotate (or GTL Draw statements), you could create your own rotated tick labels or data values. We are working on data label and tick value policies for V9.4, and would like to understand why this is important.
- Mark as New
- Bookmark
- Subscribe
- Mute
- RSS Feed
- Permalink
- Report Inappropriate Content
What about playing around with the TICKVALUEFITPOLICY options/settings?
It might be difficult to get them all on the plot though.
The default appears to be rotate which is what is occurring in your graph. Not sure what would happen if you set it to NONE though.
- Mark as New
- Bookmark
- Subscribe
- Mute
- RSS Feed
- Permalink
- Report Inappropriate Content
I actually want the tickvalues to remain rotated. It's the data labels inside the plot area that I want to change from horizontal orientation to vertical orientation (90 degree rotate) to match the orientation of the tickvalues on the x-axis.
- Mark as New
- Bookmark
- Subscribe
- Mute
- RSS Feed
- Permalink
- Report Inappropriate Content
I cannot think of any way to have 90 degree rotated datalabels or tickvalues with SAS 9.2 SG Procedures or GTL. You can get 45 degree rotated tick values automatically. With SAS 9.3 SG annotate (or GTL Draw statements), you could create your own rotated tick labels or data values. We are working on data label and tick value policies for V9.4, and would like to understand why this is important.
- Mark as New
- Bookmark
- Subscribe
- Mute
- RSS Feed
- Permalink
- Report Inappropriate Content
Thanks for the response. As you can see from the plot we have a lot of data squeezed on there and the labels for the scatters are pretty squished. My statistician thought it would look better if the datalabels for each date on the scatterplot was rotated to match the ticklabels on the x-axis as there seemed to him to be more vertical space than horizontal space. I guess if we can't do it I'll just tell him that.
As for why it's important....I guess it's better to be more flexible whenever possible? I don't know...maybe no one else would need this but it seems weird to be able to rotate text in some places in SAS and not others. It's probably not a huge deal though.
Thanks again for the response, Stacey
- Mark as New
- Bookmark
- Subscribe
- Mute
- RSS Feed
- Permalink
- Report Inappropriate Content
One way we provide for such one-off requests is by supporting annotate in SG and draw statements in GTL. Using these features at SAS 9.3 you can likely do whatever you want. Is the data set sharable? If yes, can you attaach it so I can play with the possibilities?
- Mark as New
- Bookmark
- Subscribe
- Mute
- RSS Feed
- Permalink
- Report Inappropriate Content
Would it work if you swapped your X & Y variables?
- Mark as New
- Bookmark
- Subscribe
- Mute
- RSS Feed
- Permalink
- Report Inappropriate Content
No, it won't matter because I still need the dates (labels) within the plot area to be rotated and if you say they can't rotate in 9.2 then swapping axes won't solve my problem as the datalabels will still be on the plot and not rotated. I can see where annotate would work but we're probably not getting 9.3 any time soon unfortunately.
I can't send my actual data but here's an idea of what it looks like (much more simplified).
datalines;
subject X Y ASMDT
1 1 2 03DEC10
1 12 2 07JAN11
1 27 2 14FEB11
1 50 2 31MAR11
So it's just X plotted against Y with ASMDT as the data label for the point on the graph.
- Mark as New
- Bookmark
- Subscribe
- Mute
- RSS Feed
- Permalink
- Report Inappropriate Content
I typed in a few values...Swapping X & Y will give you this:

data SubjectStudy;
input name $1-20 state $ date;
informat date date7.;
format date date7.;
Id=_n_;
datalines;
BL (01Jan10) CA 07Jan10
BL (01Jan10) CT 07Jan10
BL (01Jan10) Oth 07Jan10
C2D1(05Feb10) CA 12Feb10
C3D1(09Mar10) CA 16Mar10
C4D1(06Apr10) CA 13Apr10
C5D1(06May10) CA 13May10
C5D1(02May10) BP 13May10
C6D1(02Jun10) US 23Jun10
;
run;
proc sort data=SubjectStudy out=study;
by descending id;
run;
%let gpath='C:\';
%let dpi=100;
ods listing gpath=&gpath image_dpi=&dpi;
ods graphics / reset width=5in height=1.5in imagename='SubjectStudy';
title 'Subject 2007 - TEST CASE - Version 1';
proc sgplot data=study;
scatter y=name x=state / datalabel=date;
xaxis display=(nolabel);
yaxis display=(nolabel) grid;
run;
- Mark as New
- Bookmark
- Subscribe
- Mute
- RSS Feed
- Permalink
- Report Inappropriate Content
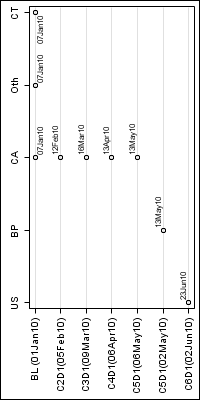
Or, use rotated output image: ![]()

- Mark as New
- Bookmark
- Subscribe
- Mute
- RSS Feed
- Permalink
- Report Inappropriate Content
Hmm...rotating the image actually looks like my best bet....thanks for the idea! I'll have to play around with it a bit to see if I can get my titles/footnotes/legends, etc. in the right place but I'll give it a shot. The first one won't work as it doesn't solve my rotation problem and they very specifically want their X & Y axes as originally specified.
What do I need to specify to get the image rotated like that?
- Mark as New
- Bookmark
- Subscribe
- Mute
- RSS Feed
- Permalink
- Report Inappropriate Content
If you say so. I just manually rotated the image, but you can find a sas image procedure feature to do it programmatically. I personally think the unrotated graph is providing you exactly the same information in a much more readable fashion. Reading text vertically is not very easy. Also, getting the titles, footnotes, etc. to look right will be a challange. I suggest it may be worth checking with your statistician.
- Mark as New
- Bookmark
- Subscribe
- Mute
- RSS Feed
- Permalink
- Report Inappropriate Content
Thanks Sanjay. I think I will check with the statistician just in case because swapping the axes would be the simplest solution here. Thank again for all the help. 🙂
- Mark as New
- Bookmark
- Subscribe
- Mute
- RSS Feed
- Permalink
- Report Inappropriate Content
Sounds like there are a few issues with getting exactly what you're wanting in your version of GTL.
Here's an alternative way to do it, using good old Gplot 🙂
data SubjectStudy;
input name $1-20 state $ date;
informat date date7.;
format date date7.;
Id=_n_;
datalines;
BL (01Jan10) CA 07Jan10
BL (01Jan10) CT 07Jan10
BL (01Jan10) Oth 07Jan10
C2D1(05Feb10) CA 12Feb10
C3D1(09Mar10) CA 16Mar10
C4D1(06Apr10) CA 13Apr10
C5D1(06May10) CA 13May10
C5D1(02May10) BP 13May10
C6D1(02Jun10) US 23Jun10
;
run;
axis1 label=none value=(angle=90) offset=(5,5);
symbol pointlabel=("#date" angle=90);
title1 "Subject 2007 - TEST CASE - Version 1";
proc gplot data=SubjectStudy;
plot state*name / haxis=axis1;
run;
Learn how use the CAT functions in SAS to join values from multiple variables into a single value.
Find more tutorials on the SAS Users YouTube channel.
SAS Training: Just a Click Away
Ready to level-up your skills? Choose your own adventure.


